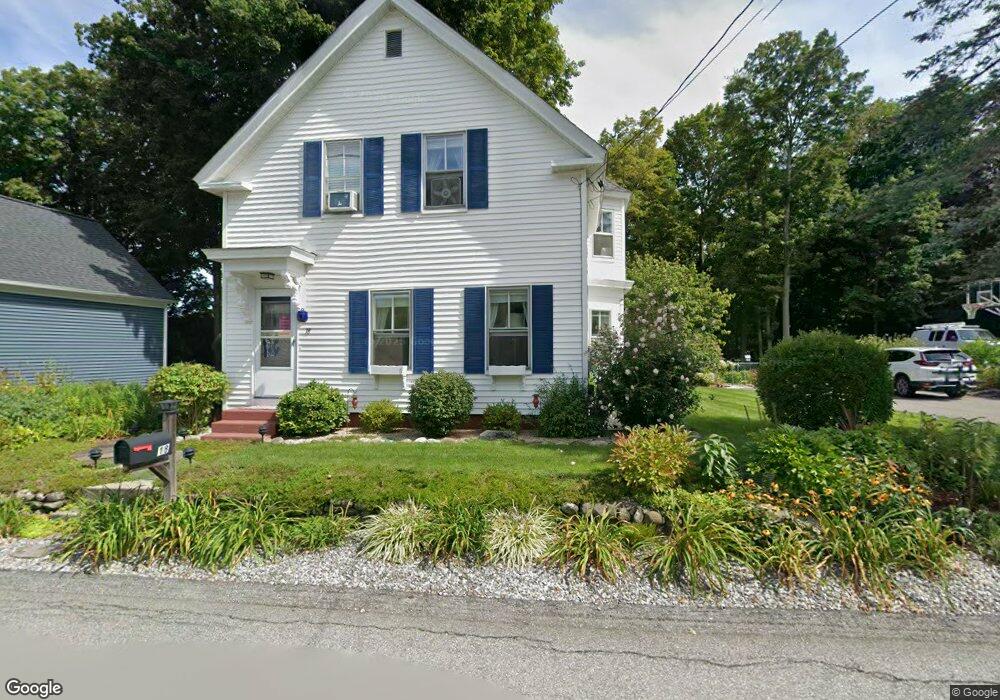
18 High St Pepperell, MA 01463
Estimated Value: $450,324 - $555,000
3
Beds
2
Baths
1,466
Sq Ft
$339/Sq Ft
Est. Value
About This Home
This home is located at 18 High St, Pepperell, MA 01463 and is currently estimated at $497,081, approximately $339 per square foot. 18 High St is a home located in Middlesex County with nearby schools including North Middlesex Regional High School, Pepperell Christian Academy, and Maple Dene & Moppet School.
Ownership History
Date
Name
Owned For
Owner Type
Purchase Details
Closed on
Apr 30, 2003
Sold by
Harvey Michelle
Bought by
Bross Linda J and Bross Edward W
Current Estimated Value
Home Financials for this Owner
Home Financials are based on the most recent Mortgage that was taken out on this home.
Original Mortgage
$137,000
Interest Rate
5.82%
Mortgage Type
Purchase Money Mortgage
Purchase Details
Closed on
Apr 10, 2001
Sold by
Gorham John W and Gorham Susan R
Bought by
Harvey Michelle
Home Financials for this Owner
Home Financials are based on the most recent Mortgage that was taken out on this home.
Original Mortgage
$164,900
Interest Rate
7.05%
Mortgage Type
Purchase Money Mortgage
Purchase Details
Closed on
Feb 28, 1997
Sold by
Kruse Cameron R and Reeves-Kruse Marla K
Bought by
Gorham John W and Gorham Susan R
Purchase Details
Closed on
May 1, 1990
Sold by
Anderson Gregory A
Bought by
Kruse Cameron R
Purchase Details
Closed on
Dec 30, 1987
Sold by
Sloat William D
Bought by
Anderson Gregory A
Create a Home Valuation Report for This Property
The Home Valuation Report is an in-depth analysis detailing your home's value as well as a comparison with similar homes in the area
Home Values in the Area
Average Home Value in this Area
Purchase History
| Date | Buyer | Sale Price | Title Company |
|---|---|---|---|
| Bross Linda J | $266,000 | -- | |
| Bross Linda J | $266,000 | -- | |
| Harvey Michelle | $194,000 | -- | |
| Gorham John W | $126,000 | -- | |
| Kruse Cameron R | $151,000 | -- | |
| Anderson Gregory A | $145,000 | -- |
Source: Public Records
Mortgage History
| Date | Status | Borrower | Loan Amount |
|---|---|---|---|
| Open | Anderson Gregory A | $134,000 | |
| Closed | Bross Linda J | $137,000 | |
| Previous Owner | Anderson Gregory A | $164,900 |
Source: Public Records
Tax History
| Year | Tax Paid | Tax Assessment Tax Assessment Total Assessment is a certain percentage of the fair market value that is determined by local assessors to be the total taxable value of land and additions on the property. | Land | Improvement |
|---|---|---|---|---|
| 2025 | $5,204 | $355,700 | $124,500 | $231,200 |
| 2024 | $4,934 | $343,800 | $112,600 | $231,200 |
| 2023 | $4,778 | $315,600 | $112,600 | $203,000 |
| 2022 | $4,668 | $272,200 | $100,800 | $171,400 |
| 2021 | $4,573 | $255,200 | $88,900 | $166,300 |
| 2020 | $4,355 | $256,500 | $88,900 | $167,600 |
| 2019 | $3,955 | $238,400 | $88,900 | $149,500 |
| 2018 | $3,639 | $222,000 | $88,900 | $133,100 |
| 2017 | $3,453 | $217,300 | $83,000 | $134,300 |
| 2016 | $3,440 | $208,100 | $83,000 | $125,100 |
| 2015 | $3,319 | $208,100 | $83,000 | $125,100 |
| 2014 | $3,237 | $204,100 | $83,000 | $121,100 |
Source: Public Records
Map
Nearby Homes
- 10 Bennett St
- 38 River Rd Unit 11
- 28-30 Groton St
- 39 Hollis St Unit A
- 29 Tarbell St
- 38 Tarbell St Unit 5B
- 38 Tarbell St Unit 1D
- 114 Groton St
- 14 Brookline St
- 33 Overlook Dr
- 208 North St
- 179 Wyman Rd
- 39 Mount Lebanon St
- 1 Nashua Rd
- 20 A Legacy Ln Unit 20A
- 24 Unkety Brook Way
- 109 Townsend St
- 120 Townsend St Unit 1
- 120 Townsend St Unit 2
- 18 Maple St Unit 14
Your Personal Tour Guide
Ask me questions while you tour the home.