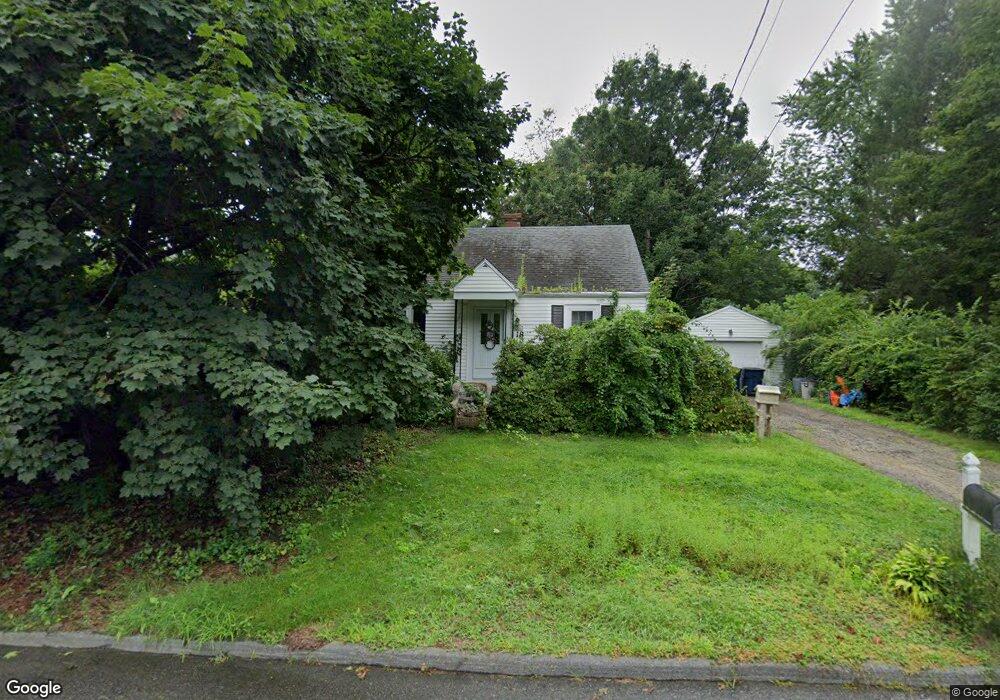
18 Highland Park Rd Rutland, MA 01543
Estimated Value: $326,000 - $445,000
3
Beds
1
Bath
1,266
Sq Ft
$309/Sq Ft
Est. Value
About This Home
This home is located at 18 Highland Park Rd, Rutland, MA 01543 and is currently estimated at $391,002, approximately $308 per square foot. 18 Highland Park Rd is a home located in Worcester County with nearby schools including Wachusett Regional High School.
Ownership History
Date
Name
Owned For
Owner Type
Purchase Details
Closed on
Jul 28, 2005
Sold by
Doerger Daniel R and Doerger Jill M
Bought by
Keevan Jennifer J and Keevan Scott E
Current Estimated Value
Home Financials for this Owner
Home Financials are based on the most recent Mortgage that was taken out on this home.
Original Mortgage
$219,000
Outstanding Balance
$115,117
Interest Rate
5.67%
Mortgage Type
Purchase Money Mortgage
Estimated Equity
$275,885
Purchase Details
Closed on
Jun 26, 2003
Sold by
Dansereau Lois J and Dansereau Roland E
Bought by
Doerger Daniel R and Doerger Jill
Home Financials for this Owner
Home Financials are based on the most recent Mortgage that was taken out on this home.
Original Mortgage
$214,000
Interest Rate
5.53%
Mortgage Type
Purchase Money Mortgage
Create a Home Valuation Report for This Property
The Home Valuation Report is an in-depth analysis detailing your home's value as well as a comparison with similar homes in the area
Home Values in the Area
Average Home Value in this Area
Purchase History
| Date | Buyer | Sale Price | Title Company |
|---|---|---|---|
| Keevan Jennifer J | $252,000 | -- | |
| Doerger Daniel R | $214,000 | -- |
Source: Public Records
Mortgage History
| Date | Status | Borrower | Loan Amount |
|---|---|---|---|
| Open | Keevan Jennifer J | $219,000 | |
| Previous Owner | Doerger Daniel R | $214,000 | |
| Previous Owner | Doerger Daniel R | $90,000 | |
| Previous Owner | Doerger Daniel R | $70,000 |
Source: Public Records
Tax History Compared to Growth
Tax History
| Year | Tax Paid | Tax Assessment Tax Assessment Total Assessment is a certain percentage of the fair market value that is determined by local assessors to be the total taxable value of land and additions on the property. | Land | Improvement |
|---|---|---|---|---|
| 2025 | $4,387 | $308,100 | $93,000 | $215,100 |
| 2024 | $3,837 | $258,700 | $83,400 | $175,300 |
| 2023 | $3,462 | $252,300 | $78,600 | $173,700 |
| 2022 | $3,452 | $218,600 | $66,600 | $152,000 |
| 2021 | $3,365 | $201,500 | $66,600 | $134,900 |
| 2020 | $3,761 | $213,600 | $62,600 | $151,000 |
| 2019 | $3,787 | $211,700 | $57,400 | $154,300 |
| 2018 | $3,764 | $207,600 | $57,400 | $150,200 |
| 2017 | $3,499 | $191,000 | $57,400 | $133,600 |
| 2016 | $3,043 | $175,200 | $55,700 | $119,500 |
| 2015 | $2,854 | $161,700 | $55,700 | $106,000 |
| 2014 | $2,767 | $161,700 | $55,700 | $106,000 |
Source: Public Records
Map
Nearby Homes
- 21 Highland Park Rd
- 85 Maple Ave Unit A
- 7 Prescott St
- 27 Lewis St
- 2 Forest Hill Dr
- 12 Lewis St
- 11 Lewis St
- 21 Lewis St
- 6 Lewis St
- 132 Fidelity Dr Unit 61
- 28 Forest Hill Dr
- 10 Fidelity Dr Unit 5
- 10 Beechwood Dr
- 176 Maple Ave Unit 1-38
- 176 Maple Ave Unit 3-25
- 176 Maple Ave Unit 2-26
- 10 Soucy Dr
- 32 Pommogussett Rd Unit 1
- 189 Maple Ave
- 25 Watson Ln
- 20 Highland Park Rd
- 16 Highland Park Rd
- 30 Highland Park Rd
- 14 Highland Park Rd
- 23 Highland Park Rd
- 32 Highland Park Rd
- 25 Highland Park Rd
- 12 Highland Park Rd
- 29 Highland Park Rd
- 29 Highland Park Rd Unit 1
- 19 Highland Park Rd
- 31 Highland Park Rd
- 27 Highland Park Rd
- 15 Highland Park Rd
- 17 Highland Park Rd
- 34 Highland Park Rd
- 33 Highland Park Rd
- 10 Highland Park Rd
- 23 Cherylann Dr
- 13 Highland Park Rd