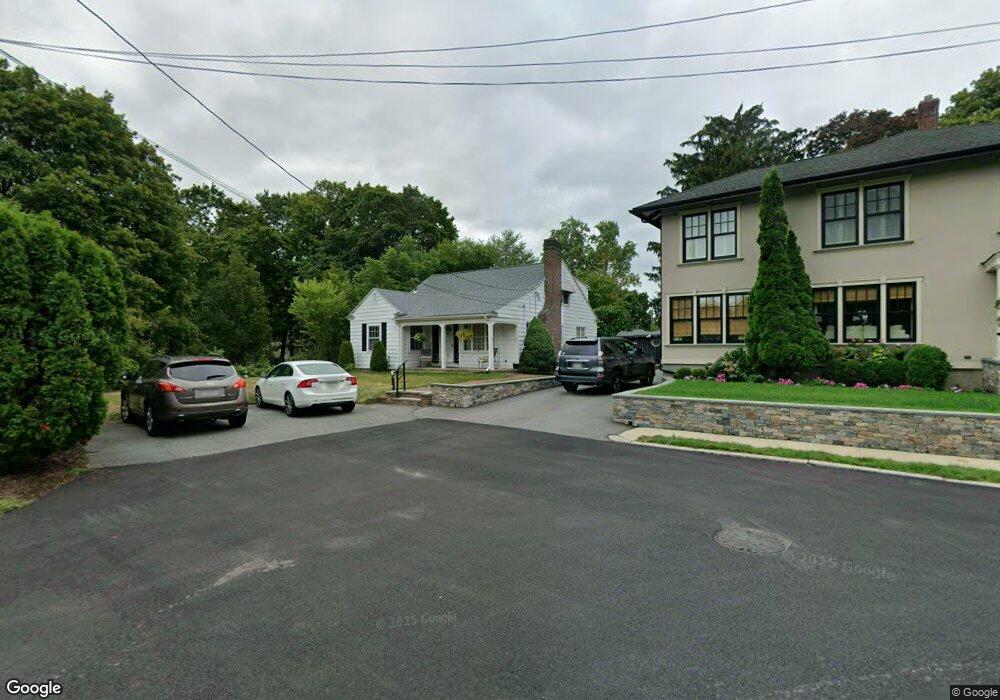
18 Hixon Ct North Attleboro, MA 02760
North Attleboro NeighborhoodEstimated Value: $486,000 - $621,000
3
Beds
2
Baths
1,767
Sq Ft
$313/Sq Ft
Est. Value
About This Home
This home is located at 18 Hixon Ct, North Attleboro, MA 02760 and is currently estimated at $552,281, approximately $312 per square foot. 18 Hixon Ct is a home located in Bristol County with nearby schools including North Attleboro High School, Cadence Academy Preschool - North Attleborough, and Bishop Feehan High School.
Ownership History
Date
Name
Owned For
Owner Type
Purchase Details
Closed on
Mar 19, 2024
Sold by
Croteau Russell J and Croteau Marie F
Bought by
Croteau Todd M and Croteau John R
Current Estimated Value
Purchase Details
Closed on
Dec 27, 2000
Sold by
Croteau Robert F and Croteau Frances E
Bought by
Croteau Russell J
Create a Home Valuation Report for This Property
The Home Valuation Report is an in-depth analysis detailing your home's value as well as a comparison with similar homes in the area
Home Values in the Area
Average Home Value in this Area
Purchase History
| Date | Buyer | Sale Price | Title Company |
|---|---|---|---|
| Croteau Todd M | -- | None Available | |
| Croteau Russell J | $180,000 | -- |
Source: Public Records
Mortgage History
| Date | Status | Borrower | Loan Amount |
|---|---|---|---|
| Previous Owner | Croteau Russell J | $44,000 | |
| Previous Owner | Croteau Russell J | $50,000 |
Source: Public Records
Tax History Compared to Growth
Tax History
| Year | Tax Paid | Tax Assessment Tax Assessment Total Assessment is a certain percentage of the fair market value that is determined by local assessors to be the total taxable value of land and additions on the property. | Land | Improvement |
|---|---|---|---|---|
| 2025 | $5,280 | $447,800 | $128,800 | $319,000 |
| 2024 | $5,018 | $434,800 | $128,800 | $306,000 |
| 2023 | $5,139 | $401,800 | $134,400 | $267,400 |
| 2022 | $4,729 | $339,500 | $128,800 | $210,700 |
| 2021 | $4,778 | $334,800 | $128,800 | $206,000 |
| 2020 | $4,658 | $324,600 | $128,800 | $195,800 |
| 2019 | $4,456 | $312,900 | $117,100 | $195,800 |
| 2018 | $3,970 | $297,600 | $117,100 | $180,500 |
| 2017 | $3,686 | $278,800 | $117,100 | $161,700 |
| 2016 | $3,843 | $290,700 | $135,800 | $154,900 |
| 2015 | $3,603 | $274,200 | $141,400 | $132,800 |
| 2014 | $3,356 | $253,500 | $124,100 | $129,400 |
Source: Public Records
Map
Nearby Homes
- 80 Broadway Unit 9
- 300 E Washington St Unit 54R
- 137 Sumner St
- 93 Bank St
- 50 Metcalf Rd
- 16 Richards Ave Unit 106
- 130 E Washington St Unit 71
- 130 E Washington St Unit 36
- 160 Crescent Ave
- 40 Roosevelt Ave
- 19 Church St Unit C9
- 12 Roosevelt Ave
- 16 Johnson St
- 27 Taylor St
- 46 Westside Ave
- 0 Anawan Rd
- 880 Landry Ave Unit 2
- 42 2nd Ave Unit 24
- 30 Sperry Ln Unit Lot 15
- 304 Elm St