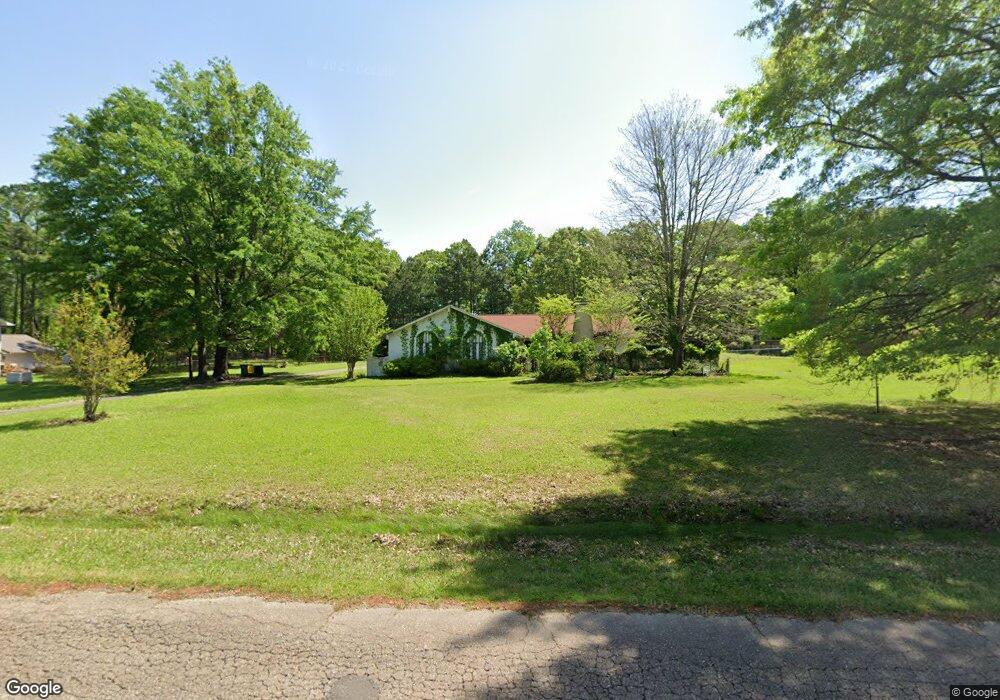
18 Holly Ridge Dr Texarkana, TX 75503
Estimated Value: $286,000 - $329,000
--
Bed
--
Bath
2,120
Sq Ft
$143/Sq Ft
Est. Value
About This Home
This home is located at 18 Holly Ridge Dr, Texarkana, TX 75503 and is currently estimated at $302,751, approximately $142 per square foot. 18 Holly Ridge Dr is a home located in Bowie County with nearby schools including Margaret Fischer Davis Elementary School, Pleasant Grove Intermediate School, and Pleasant Grove Middle School.
Ownership History
Date
Name
Owned For
Owner Type
Purchase Details
Closed on
Oct 8, 2025
Sold by
Carrillo Opportunity Zone Llc
Bought by
Carrillo Jacob
Current Estimated Value
Home Financials for this Owner
Home Financials are based on the most recent Mortgage that was taken out on this home.
Original Mortgage
$200,100
Outstanding Balance
$197,258
Interest Rate
6.35%
Mortgage Type
New Conventional
Estimated Equity
$105,493
Purchase Details
Closed on
Sep 27, 2024
Sold by
Cunningham John Lincoln and Griffith Sarah Frances
Bought by
Carrillo Opportunity Zone Llc
Home Financials for this Owner
Home Financials are based on the most recent Mortgage that was taken out on this home.
Original Mortgage
$195,500
Interest Rate
6.49%
Mortgage Type
New Conventional
Create a Home Valuation Report for This Property
The Home Valuation Report is an in-depth analysis detailing your home's value as well as a comparison with similar homes in the area
Home Values in the Area
Average Home Value in this Area
Purchase History
| Date | Buyer | Sale Price | Title Company |
|---|---|---|---|
| Carrillo Jacob | -- | Twin City Title | |
| Carrillo Opportunity Zone Llc | -- | Twin City Title |
Source: Public Records
Mortgage History
| Date | Status | Borrower | Loan Amount |
|---|---|---|---|
| Open | Carrillo Jacob | $200,100 | |
| Previous Owner | Carrillo Opportunity Zone Llc | $195,500 |
Source: Public Records
Tax History Compared to Growth
Tax History
| Year | Tax Paid | Tax Assessment Tax Assessment Total Assessment is a certain percentage of the fair market value that is determined by local assessors to be the total taxable value of land and additions on the property. | Land | Improvement |
|---|---|---|---|---|
| 2025 | $1,287 | $181,052 | $35,000 | $146,052 |
| 2024 | $1,287 | $246,739 | $35,000 | $211,739 |
| 2023 | $2,166 | $225,398 | $0 | $0 |
| 2022 | $5,031 | $219,720 | $35,000 | $184,720 |
| 2021 | $4,872 | $186,279 | $35,000 | $151,279 |
| 2020 | $4,698 | $178,722 | $35,000 | $143,722 |
| 2019 | $4,644 | $172,181 | $35,000 | $137,181 |
| 2018 | $4,531 | $168,910 | $35,000 | $133,910 |
| 2017 | $4,452 | $166,418 | $35,000 | $131,418 |
| 2016 | $4,354 | $162,780 | $35,000 | $127,780 |
| 2015 | $2,764 | $164,919 | $35,000 | $129,919 |
| 2014 | $2,764 | $163,710 | $35,000 | $128,710 |
Source: Public Records
Map
Nearby Homes
- 918 Clear Creek Dr
- 26 Summer Ln
- 23 Holly Ridge Dr
- 4 Holly Ridge Dr
- 8 Wild Oak Cir
- 6301 Pecan Cove
- 604 Clear Creek Dr
- 3501 Clear Creek Cir
- 6210 Gould Place
- 3409 Williamsburg Ln
- 3407 Williamsburg Ln
- 6107 Ben Burrough Rd
- 7202 Shilling Cir
- 6106 Ben Burrough Rd
- 6137 Summerhill Place
- 7 Brittan Place
- 6131 Summerhill Place
- 13 Brittan Place
- 11 Dogwood Place
- 16 Dogwood Place
- 16 Holly Ridge Dr
- 20 Holly Ridge Dr
- 11 Holly Ridge Dr
- 15 Holly Ridge Dr
- 14 Holly Ridge Dr
- 22 Holly Ridge Dr
- 9 Holly Ridge Dr
- 30 Summer Ln
- 17 Holly Ridge Dr
- 12 Holly Ridge Dr
- 914 Clear Creek Dr
- 912 Clear Creek Dr
- 7 Holly Ridge Dr
- 28 Summer Ln
- 910 Clear Creek Dr
- 19 Holly Ridge Dr
- 908 Clear Creek Dr
- 10 Holly Ridge Dr
- 5 Holly Ridge Dr
- 31 Summer Ln