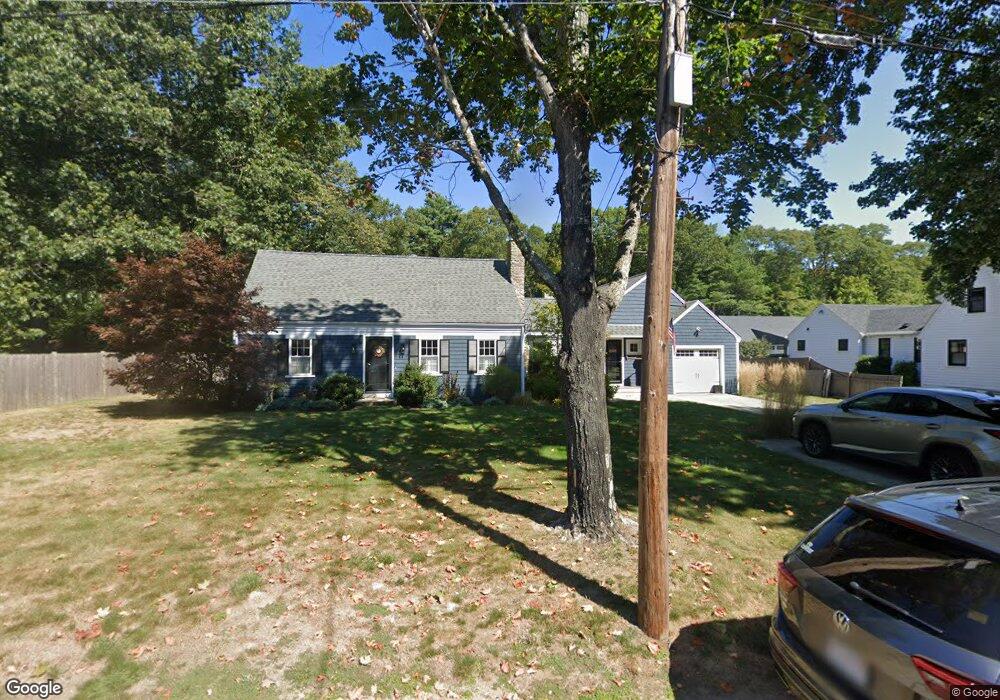
18 Huntley Rd Hingham, MA 02043
South Hingham NeighborhoodEstimated Value: $1,071,000 - $1,330,000
3
Beds
2
Baths
1,584
Sq Ft
$755/Sq Ft
Est. Value
About This Home
This home is located at 18 Huntley Rd, Hingham, MA 02043 and is currently estimated at $1,195,247, approximately $754 per square foot. 18 Huntley Rd is a home located in Plymouth County with nearby schools including South Elementary School, Fusion Academy Hingham, and The Accord School.
Ownership History
Date
Name
Owned For
Owner Type
Purchase Details
Closed on
Jul 27, 2022
Sold by
Chapman Kevin H and Chapman Meaghan K
Bought by
M K H
Current Estimated Value
Purchase Details
Closed on
Apr 27, 2012
Sold by
Meehan Paul and Meehan Eileen
Bought by
Chapman Kevin H and Chapman Meaghan K
Home Financials for this Owner
Home Financials are based on the most recent Mortgage that was taken out on this home.
Original Mortgage
$448,000
Interest Rate
3.91%
Mortgage Type
New Conventional
Purchase Details
Closed on
May 18, 1987
Sold by
Kearns Thomas J
Bought by
Meehan Paul
Home Financials for this Owner
Home Financials are based on the most recent Mortgage that was taken out on this home.
Original Mortgage
$140,000
Interest Rate
9.31%
Mortgage Type
Purchase Money Mortgage
Create a Home Valuation Report for This Property
The Home Valuation Report is an in-depth analysis detailing your home's value as well as a comparison with similar homes in the area
Home Values in the Area
Average Home Value in this Area
Purchase History
| Date | Buyer | Sale Price | Title Company |
|---|---|---|---|
| M K H | -- | None Available | |
| Chapman Kevin H | $560,000 | -- | |
| Meehan Paul | $240,000 | -- |
Source: Public Records
Mortgage History
| Date | Status | Borrower | Loan Amount |
|---|---|---|---|
| Previous Owner | Chapman Kevin H | $448,000 | |
| Previous Owner | Meehan Paul | $8,831 | |
| Previous Owner | Meehan Paul | $125,000 | |
| Previous Owner | Meehan Paul | $140,000 |
Source: Public Records
Tax History Compared to Growth
Tax History
| Year | Tax Paid | Tax Assessment Tax Assessment Total Assessment is a certain percentage of the fair market value that is determined by local assessors to be the total taxable value of land and additions on the property. | Land | Improvement |
|---|---|---|---|---|
| 2025 | $11,151 | $1,043,100 | $478,700 | $564,400 |
| 2024 | $10,695 | $985,700 | $478,700 | $507,000 |
| 2023 | $9,126 | $912,600 | $478,700 | $433,900 |
| 2022 | $8,523 | $737,300 | $399,000 | $338,300 |
| 2021 | $8,188 | $693,900 | $399,000 | $294,900 |
| 2020 | $8,001 | $693,900 | $399,000 | $294,900 |
| 2019 | $7,910 | $669,800 | $399,000 | $270,800 |
| 2018 | $7,826 | $664,900 | $399,000 | $265,900 |
| 2017 | $7,966 | $650,300 | $398,100 | $252,200 |
| 2016 | $7,723 | $618,300 | $379,200 | $239,100 |
| 2015 | $6,955 | $555,100 | $361,300 | $193,800 |
Source: Public Records
Map
Nearby Homes