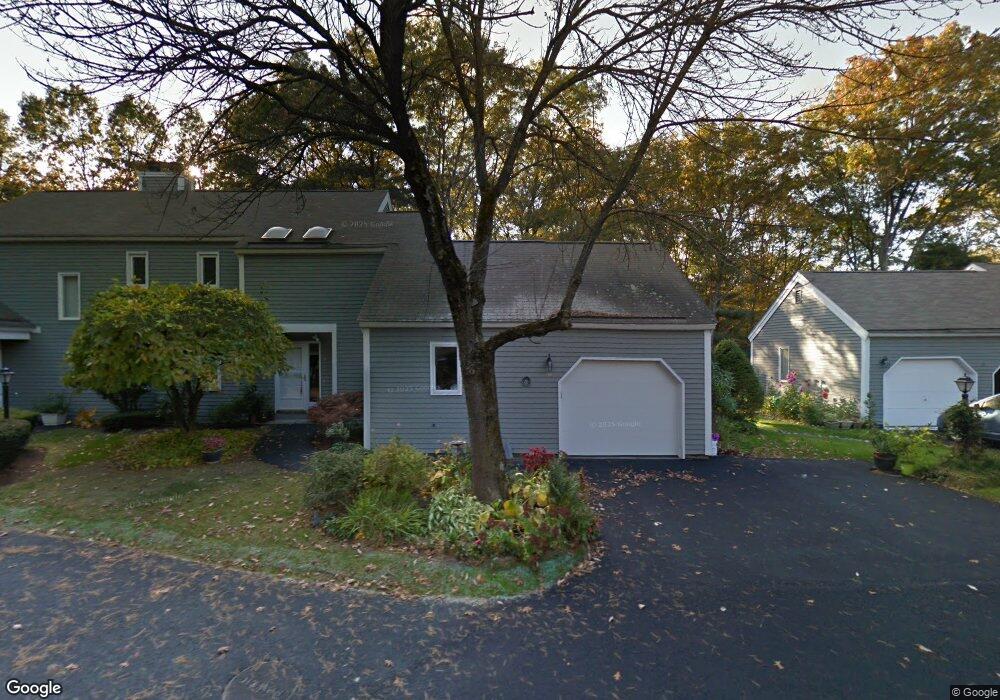
18 Indian Dawn Wayland, MA 01778
Estimated Value: $742,000 - $878,000
2
Beds
3
Baths
1,672
Sq Ft
$475/Sq Ft
Est. Value
About This Home
This home is located at 18 Indian Dawn, Wayland, MA 01778 and is currently estimated at $794,645, approximately $475 per square foot. 18 Indian Dawn is a home located in Middlesex County with nearby schools including Wayland High School, Veritas Christian Academy, and The Rivers School.
Ownership History
Date
Name
Owned For
Owner Type
Purchase Details
Closed on
May 3, 2022
Sold by
Mazokopos Sophie
Bought by
Sophie P Mazokopos Ret
Current Estimated Value
Purchase Details
Closed on
Jan 25, 2007
Sold by
Brickett Rt and Brickett Malcolm H
Bought by
Mazokopos Sophie
Purchase Details
Closed on
Dec 31, 1996
Sold by
Segel Roberta M
Bought by
Brickett Malcolm H
Purchase Details
Closed on
Aug 8, 1994
Sold by
Kinch Lester and Kinch Mary A
Bought by
Segel Gerald B and Segel Roberta M
Home Financials for this Owner
Home Financials are based on the most recent Mortgage that was taken out on this home.
Original Mortgage
$214,000
Interest Rate
8.4%
Mortgage Type
Purchase Money Mortgage
Create a Home Valuation Report for This Property
The Home Valuation Report is an in-depth analysis detailing your home's value as well as a comparison with similar homes in the area
Home Values in the Area
Average Home Value in this Area
Purchase History
| Date | Buyer | Sale Price | Title Company |
|---|---|---|---|
| Sophie P Mazokopos Ret | -- | None Available | |
| Mazokopos Sophie | $435,000 | -- | |
| Brickett Malcolm H | $340,000 | -- | |
| Segel Gerald B | $239,000 | -- |
Source: Public Records
Mortgage History
| Date | Status | Borrower | Loan Amount |
|---|---|---|---|
| Previous Owner | Brickett Malcolm H | $212,000 | |
| Previous Owner | Segel Gerald B | $214,000 |
Source: Public Records
Tax History Compared to Growth
Tax History
| Year | Tax Paid | Tax Assessment Tax Assessment Total Assessment is a certain percentage of the fair market value that is determined by local assessors to be the total taxable value of land and additions on the property. | Land | Improvement |
|---|---|---|---|---|
| 2025 | $10,097 | $646,000 | $0 | $646,000 |
| 2024 | $10,026 | $646,000 | $0 | $646,000 |
| 2023 | $9,639 | $578,900 | $0 | $578,900 |
| 2022 | $9,788 | $533,400 | $0 | $533,400 |
| 2021 | $8,749 | $472,400 | $0 | $472,400 |
| 2020 | $8,855 | $498,600 | $0 | $498,600 |
| 2019 | $8,634 | $472,300 | $0 | $472,300 |
| 2018 | $7,625 | $422,900 | $0 | $422,900 |
| 2017 | $7,465 | $411,500 | $0 | $411,500 |
| 2016 | $7,061 | $407,200 | $0 | $407,200 |
| 2015 | $7,564 | $411,300 | $0 | $411,300 |
Source: Public Records
Map
Nearby Homes
- 1 Indian Dawn
- 3 Indian Dawn
- 10 Indian Dawn
- 11 Indian Dawn
- 12 Indian Dawn
- 13 Indian Dawn
- 14 Indian Dawn
- 19 Indian Dawn
- 11 Indian Dawn Unit 11ID
- 18 Indian Dawn Unit Type D
- 18 Indian Dawn Unit 18D
- 12 Indian Dawn Unit 12ID
- 19 Indian Dawn Unit 2
- 4 Indian Dawn
- 5 Indian Dawn
- 5 Indian Dawn Unit 5
- 6 Indian Dawn
- 7 Indian Dawn
- 8 Indian Dawn
- 9 Indian Dawn