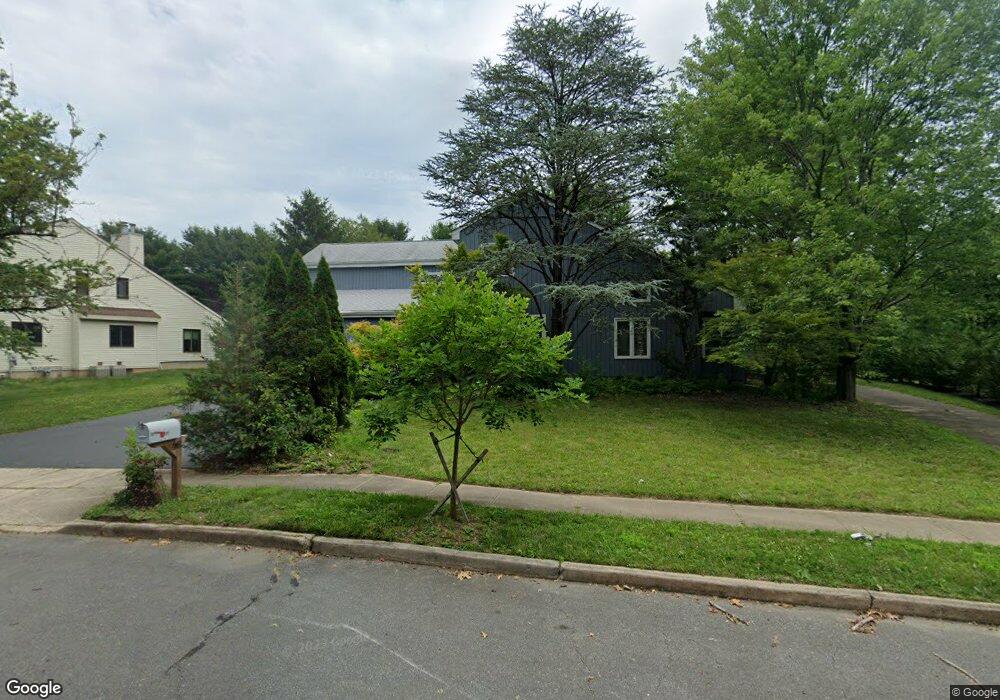
18 Indian Run Rd Princeton Junction, NJ 08550
Estimated Value: $1,117,789 - $1,226,000
5
Beds
3
Baths
3,172
Sq Ft
$371/Sq Ft
Est. Value
About This Home
This home is located at 18 Indian Run Rd, Princeton Junction, NJ 08550 and is currently estimated at $1,177,197, approximately $371 per square foot. 18 Indian Run Rd is a home located in Mercer County with nearby schools including Maurice Hawk Elementary School, Village Elementary School, and Thomas R. Grover Middle School.
Ownership History
Date
Name
Owned For
Owner Type
Purchase Details
Closed on
May 10, 2013
Sold by
Arya Angiras and Ilangovan Kani M
Bought by
Ilangovan Kani M and Arya Angiras
Current Estimated Value
Purchase Details
Closed on
Mar 10, 2011
Sold by
Govande Valdehi
Bought by
Arya Angiras and Ilangovan Kani
Home Financials for this Owner
Home Financials are based on the most recent Mortgage that was taken out on this home.
Original Mortgage
$400,000
Outstanding Balance
$18,506
Interest Rate
4.83%
Mortgage Type
New Conventional
Estimated Equity
$1,158,691
Purchase Details
Closed on
May 20, 1996
Sold by
Brigiotta Thomas
Bought by
Hovanole Shiriam and Govande Haidehi
Home Financials for this Owner
Home Financials are based on the most recent Mortgage that was taken out on this home.
Original Mortgage
$288,000
Interest Rate
8.05%
Mortgage Type
Purchase Money Mortgage
Purchase Details
Closed on
Aug 27, 1992
Sold by
Chung Kwong T and Cynthia Chu
Bought by
Brigiotta Thomas and Brigiotta Patricia
Create a Home Valuation Report for This Property
The Home Valuation Report is an in-depth analysis detailing your home's value as well as a comparison with similar homes in the area
Home Values in the Area
Average Home Value in this Area
Purchase History
| Date | Buyer | Sale Price | Title Company |
|---|---|---|---|
| Ilangovan Kani M | -- | None Available | |
| Arya Angiras | $605,000 | None Available | |
| Hovanole Shiriam | $360,000 | -- | |
| Brigiotta Thomas | $334,000 | -- |
Source: Public Records
Mortgage History
| Date | Status | Borrower | Loan Amount |
|---|---|---|---|
| Open | Arya Angiras | $400,000 | |
| Previous Owner | Hovanole Shiriam | $288,000 |
Source: Public Records
Tax History Compared to Growth
Tax History
| Year | Tax Paid | Tax Assessment Tax Assessment Total Assessment is a certain percentage of the fair market value that is determined by local assessors to be the total taxable value of land and additions on the property. | Land | Improvement |
|---|---|---|---|---|
| 2025 | $18,166 | $592,700 | $256,000 | $365,300 |
| 2024 | $17,408 | $592,700 | $256,000 | $365,300 |
| 2023 | $17,408 | $621,300 | $256,000 | $365,300 |
| 2022 | $17,070 | $592,700 | $0 | $0 |
| 2021 | $16,928 | $592,700 | $0 | $0 |
| 2020 | $16,619 | $592,700 | $0 | $0 |
| 2019 | $16,430 | $621,300 | $256,000 | $365,300 |
| 2018 | $16,276 | $621,300 | $256,000 | $365,300 |
| 2017 | $15,938 | $621,300 | $256,000 | $365,300 |
| 2016 | $15,594 | $592,700 | $256,000 | $336,700 |
| 2015 | $15,232 | $592,700 | $256,000 | $336,700 |
| 2014 | $15,055 | $592,700 | $256,000 | $336,700 |
Source: Public Records
Map
Nearby Homes
- 24 Hereford Dr
- 298 N Post Rd
- 1 Hawk Dr
- 3 Yorktowne Ct
- 12 Ziff La
- 12 Ziff Ln
- 42 Nassau Place
- 9 Wedgewood Ct
- 40 Caleb Ln
- 10 Norbridge Dr
- 90 Princeton Hightstown Rd
- 103 Harris Rd
- 951 Alexander Rd
- 43 Wallace Rd
- 3103 Justin Dr
- 1005 Justin Dr Unit 1002
- 2902 Justin Dr
- 1402 Justin Dr Unit 1403
- 3102 Justin Dr
- 2904 Justin Dr Unit 2903
- 20 Indian Run Rd
- 16 Indian Run Rd
- 33 Arnold Dr
- 22 Indian Run Rd
- 31 Arnold Dr
- 14 Indian Run Rd
- 17 Indian Run Rd
- 35 Arnold Dr
- 19 Indian Run Rd
- 24 Indian Run Rd
- 12 Indian Run Rd
- 29 Arnold Dr
- 21 Indian Run Rd
- 37 Arnold Dr
- 26 Indian Run Rd
- 23 Indian Run Rd
- 10 Indian Run Rd
- 22 Arnold Dr
- 39 Arnold Dr
- 2 Wellington Dr