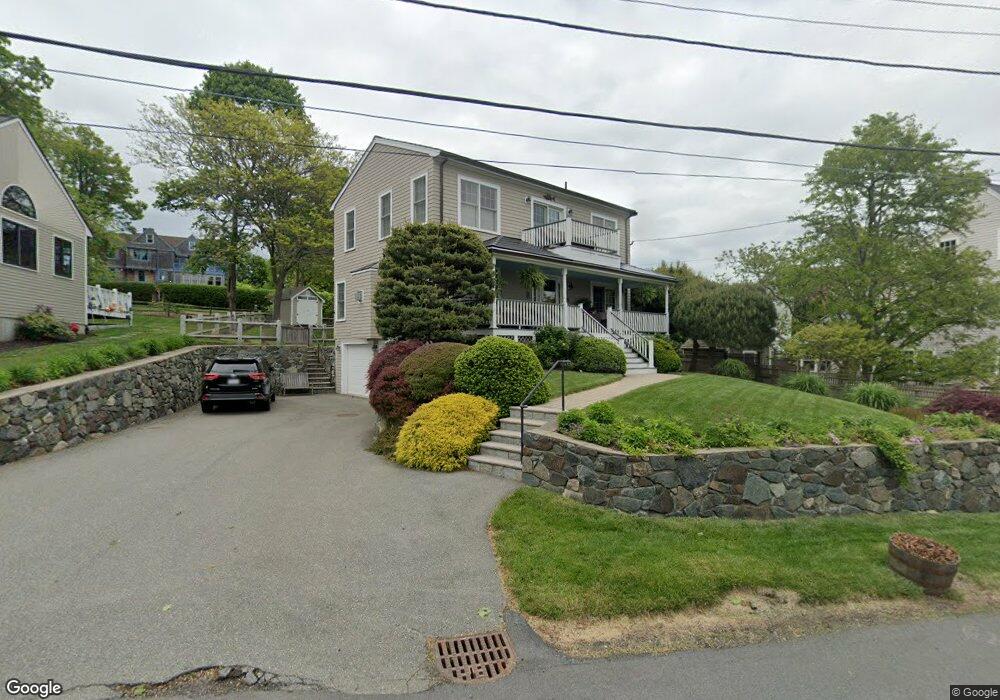
18 Intervale Rd Nahant, MA 01908
Estimated Value: $986,000 - $1,441,000
3
Beds
3
Baths
1,872
Sq Ft
$633/Sq Ft
Est. Value
About This Home
This home is located at 18 Intervale Rd, Nahant, MA 01908 and is currently estimated at $1,185,903, approximately $633 per square foot. 18 Intervale Rd is a home located in Essex County with nearby schools including Johnson Elementary School, Swampscott Middle School, and Swampscott High School.
Ownership History
Date
Name
Owned For
Owner Type
Purchase Details
Closed on
May 2, 2017
Sold by
Lenzi Paul M and Lenzi Michelle C
Bought by
Lenzi Ft and Lenzi
Current Estimated Value
Purchase Details
Closed on
May 18, 2009
Sold by
Lenzi Paul M and Anderson Michelle C
Bought by
Lenzi Paul M
Purchase Details
Closed on
Sep 29, 2000
Sold by
Merrick Nancy and Merrick Brian R
Bought by
Lenzi Paul M and Anderson Michelle C
Purchase Details
Closed on
Apr 16, 1997
Sold by
Gaudet Marcia A
Bought by
Merrick Brian R and Merrick Nancy
Purchase Details
Closed on
Aug 4, 1994
Sold by
Intervale Rt
Bought by
Gaudet Marcia A
Create a Home Valuation Report for This Property
The Home Valuation Report is an in-depth analysis detailing your home's value as well as a comparison with similar homes in the area
Home Values in the Area
Average Home Value in this Area
Purchase History
| Date | Buyer | Sale Price | Title Company |
|---|---|---|---|
| Lenzi Ft | -- | -- | |
| Lenzi Ft | -- | -- | |
| Lenzi Paul M | -- | -- | |
| Lenzi Paul M | -- | -- | |
| Lenzi Paul M | $495,000 | -- | |
| Lenzi Paul M | $495,000 | -- | |
| Merrick Brian R | $160,000 | -- | |
| Merrick Brian R | $160,000 | -- | |
| Gaudet Marcia A | $95,000 | -- | |
| Gaudet Marcia A | $95,000 | -- |
Source: Public Records
Mortgage History
| Date | Status | Borrower | Loan Amount |
|---|---|---|---|
| Previous Owner | Gaudet Marcia A | $375,000 | |
| Previous Owner | Gaudet Marcia A | $50,000 |
Source: Public Records
Tax History Compared to Growth
Tax History
| Year | Tax Paid | Tax Assessment Tax Assessment Total Assessment is a certain percentage of the fair market value that is determined by local assessors to be the total taxable value of land and additions on the property. | Land | Improvement |
|---|---|---|---|---|
| 2025 | $9,820 | $1,073,200 | $628,000 | $445,200 |
| 2024 | $9,515 | $1,049,100 | $603,900 | $445,200 |
| 2023 | $8,677 | $954,600 | $531,400 | $423,200 |
| 2022 | $8,016 | $818,800 | $458,900 | $359,900 |
| 2021 | $7,870 | $748,800 | $410,600 | $338,200 |
| 2020 | $7,693 | $701,300 | $410,600 | $290,700 |
| 2019 | $6,802 | $623,500 | $362,300 | $261,200 |
| 2018 | $6,385 | $622,900 | $362,300 | $260,600 |
| 2017 | $6,567 | $627,200 | $362,300 | $264,900 |
| 2016 | $6,366 | $605,100 | $350,200 | $254,900 |
| 2015 | $7,174 | $657,000 | $402,100 | $254,900 |
| 2014 | $6,898 | $625,400 | $365,300 | $260,100 |
Source: Public Records
Map
Nearby Homes
- 303 Nahant Rd
- 66 Ocean St
- 51 Cliff St
- 3 Cliff St
- 2 Goddard Dr
- 183 Bass Point Rd
- 17 Pearl Rd
- 23 Phillips Rd
- 43 Maple Ave
- 9 Little Nahant Rd
- 36 Lennox Rd
- 9 Beach Rd Unit 4
- 45 Tudor St Unit 3-8
- 41 Tudor St
- 12 Chancery Ct Unit 205
- 12 Chancery Ct Unit 207
- 300 Lynn Shore Dr Unit 612
- 98 Lynnway Unit 102
- 285 Lynn Shore Dr Unit 508
- 285 Lynn Shore Dr Unit 203