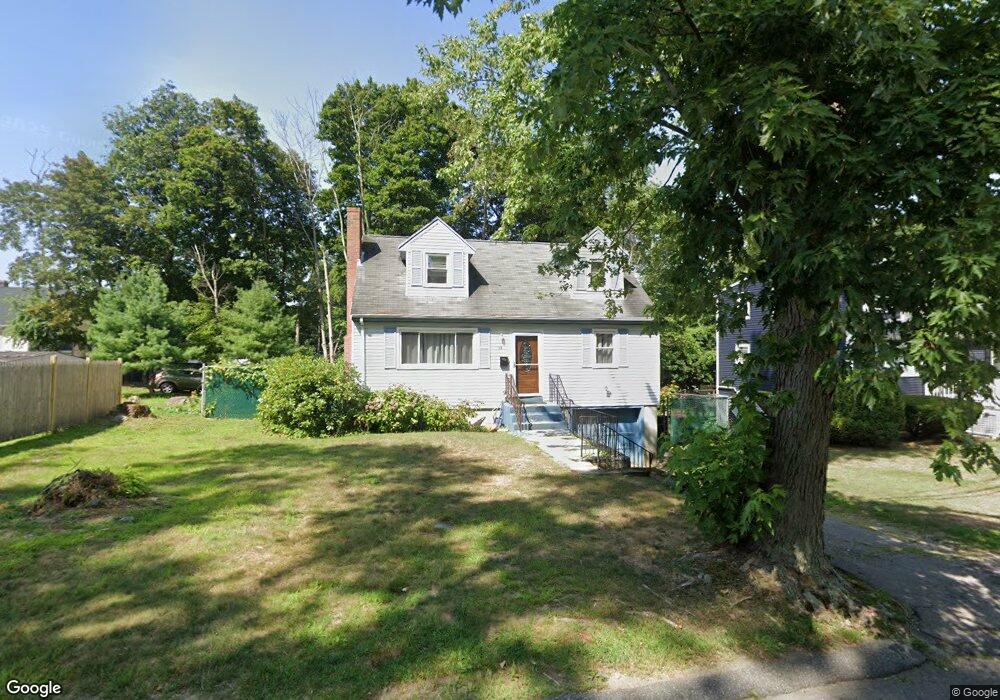
18 Jordan St Brockton, MA 02302
Montello NeighborhoodEstimated Value: $477,000 - $506,490
3
Beds
2
Baths
1,400
Sq Ft
$352/Sq Ft
Est. Value
About This Home
This home is located at 18 Jordan St, Brockton, MA 02302 and is currently estimated at $493,123, approximately $352 per square foot. 18 Jordan St is a home located in Plymouth County with nearby schools including Brookfield Elementary School, Mary E. Baker Elementary School, and Downey Elementary School.
Ownership History
Date
Name
Owned For
Owner Type
Purchase Details
Closed on
Apr 9, 2013
Sold by
Pierre Natacha and Pierre Lionel
Bought by
Pierre Natacha L
Current Estimated Value
Purchase Details
Closed on
Nov 29, 2000
Sold by
Gaston Betty P
Bought by
Pierre Lionel and Pierre Natacha L
Purchase Details
Closed on
Aug 22, 1997
Sold by
Usa-Va
Bought by
Gaston Betty P
Purchase Details
Closed on
Sep 30, 1996
Sold by
Johnson Arthur G
Bought by
Chase Mtg Svcs Inc
Purchase Details
Closed on
May 23, 1988
Sold by
Magnan Patricia A
Bought by
Johnson Arthur G
Create a Home Valuation Report for This Property
The Home Valuation Report is an in-depth analysis detailing your home's value as well as a comparison with similar homes in the area
Home Values in the Area
Average Home Value in this Area
Purchase History
| Date | Buyer | Sale Price | Title Company |
|---|---|---|---|
| Pierre Natacha L | -- | -- | |
| Pierre Lionel | $145,000 | -- | |
| Gaston Betty P | $103,910 | -- | |
| Chase Mtg Svcs Inc | $72,157 | -- | |
| Johnson Arthur G | $126,000 | -- |
Source: Public Records
Mortgage History
| Date | Status | Borrower | Loan Amount |
|---|---|---|---|
| Open | Johnson Arthur G | $156,000 | |
| Previous Owner | Johnson Arthur G | $17,000 |
Source: Public Records
Tax History Compared to Growth
Tax History
| Year | Tax Paid | Tax Assessment Tax Assessment Total Assessment is a certain percentage of the fair market value that is determined by local assessors to be the total taxable value of land and additions on the property. | Land | Improvement |
|---|---|---|---|---|
| 2025 | $5,366 | $443,100 | $156,700 | $286,400 |
| 2024 | $5,020 | $417,600 | $156,700 | $260,900 |
| 2023 | $5,109 | $393,600 | $106,800 | $286,800 |
| 2022 | $4,769 | $341,400 | $97,000 | $244,400 |
| 2021 | $4,554 | $314,100 | $89,000 | $225,100 |
| 2020 | $4,533 | $299,200 | $78,500 | $220,700 |
| 2019 | $4,266 | $274,500 | $74,500 | $200,000 |
| 2018 | $3,699 | $230,300 | $74,500 | $155,800 |
| 2017 | $3,511 | $218,100 | $74,500 | $143,600 |
| 2016 | $3,352 | $193,100 | $71,100 | $122,000 |
| 2015 | $3,233 | $178,100 | $71,100 | $107,000 |
| 2014 | $3,296 | $181,800 | $71,100 | $110,700 |
Source: Public Records
Map
Nearby Homes