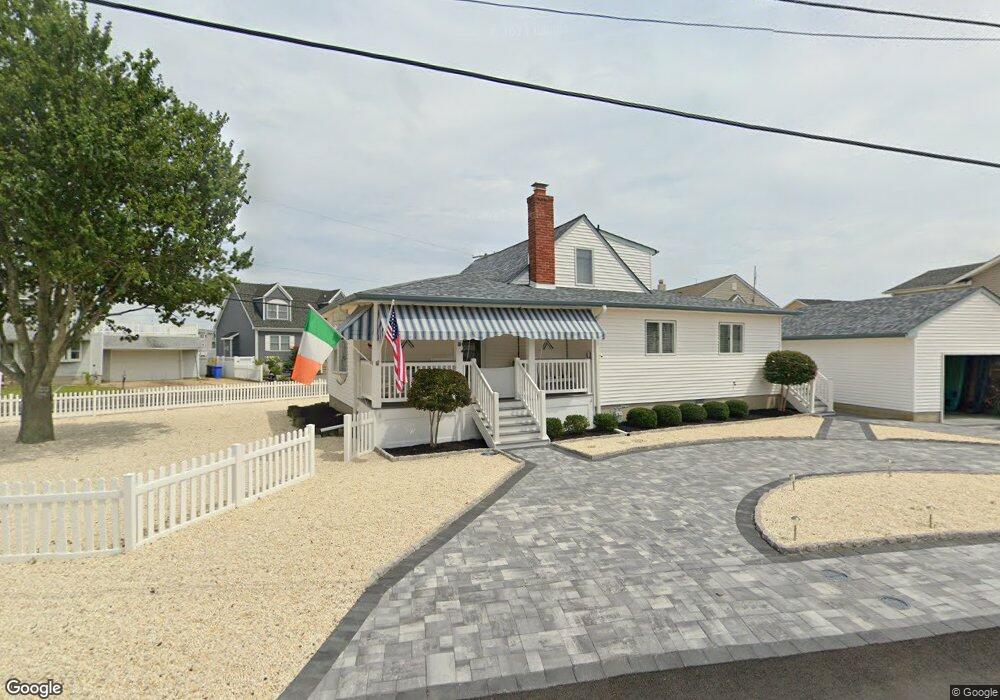
18 Joshua Dr Manahawkin, NJ 08050
Stafford NeighborhoodEstimated Value: $331,000 - $864,000
3
Beds
1
Bath
1,514
Sq Ft
$369/Sq Ft
Est. Value
About This Home
This home is located at 18 Joshua Dr, Manahawkin, NJ 08050 and is currently estimated at $558,999, approximately $369 per square foot. 18 Joshua Dr is a home located in Ocean County with nearby schools including Oxycocus Elementary School, Ocean Acres Elementary School, and McKinley Avenue Elementary School.
Ownership History
Date
Name
Owned For
Owner Type
Purchase Details
Closed on
Aug 4, 2025
Sold by
Ryan John T
Bought by
John Ryan Living Trust
Current Estimated Value
Purchase Details
Closed on
Sep 4, 2001
Sold by
Castelli Anthony
Bought by
Ryan John
Home Financials for this Owner
Home Financials are based on the most recent Mortgage that was taken out on this home.
Original Mortgage
$128,000
Interest Rate
6.99%
Create a Home Valuation Report for This Property
The Home Valuation Report is an in-depth analysis detailing your home's value as well as a comparison with similar homes in the area
Home Values in the Area
Average Home Value in this Area
Purchase History
| Date | Buyer | Sale Price | Title Company |
|---|---|---|---|
| John Ryan Living Trust | -- | None Listed On Document | |
| John Ryan Living Trust | -- | None Listed On Document | |
| Ryan John | $160,000 | -- |
Source: Public Records
Mortgage History
| Date | Status | Borrower | Loan Amount |
|---|---|---|---|
| Previous Owner | Ryan John | $128,000 |
Source: Public Records
Tax History Compared to Growth
Tax History
| Year | Tax Paid | Tax Assessment Tax Assessment Total Assessment is a certain percentage of the fair market value that is determined by local assessors to be the total taxable value of land and additions on the property. | Land | Improvement |
|---|---|---|---|---|
| 2025 | $4,772 | $192,200 | $102,800 | $89,400 |
| 2024 | $4,476 | $192,200 | $102,800 | $89,400 |
| 2023 | $4,274 | $192,200 | $102,800 | $89,400 |
| 2022 | $4,524 | $192,200 | $102,800 | $89,400 |
| 2021 | $4,213 | $192,200 | $102,800 | $89,400 |
| 2020 | $4,469 | $192,200 | $102,800 | $89,400 |
| 2019 | $4,405 | $192,200 | $102,800 | $89,400 |
| 2018 | $4,378 | $192,200 | $102,800 | $89,400 |
| 2017 | $5,120 | $217,600 | $98,300 | $119,300 |
| 2016 | $4,818 | $217,600 | $98,300 | $119,300 |
| 2015 | $4,639 | $217,600 | $98,300 | $119,300 |
| 2014 | $4,584 | $212,500 | $97,700 | $114,800 |
Source: Public Records
Map
Nearby Homes