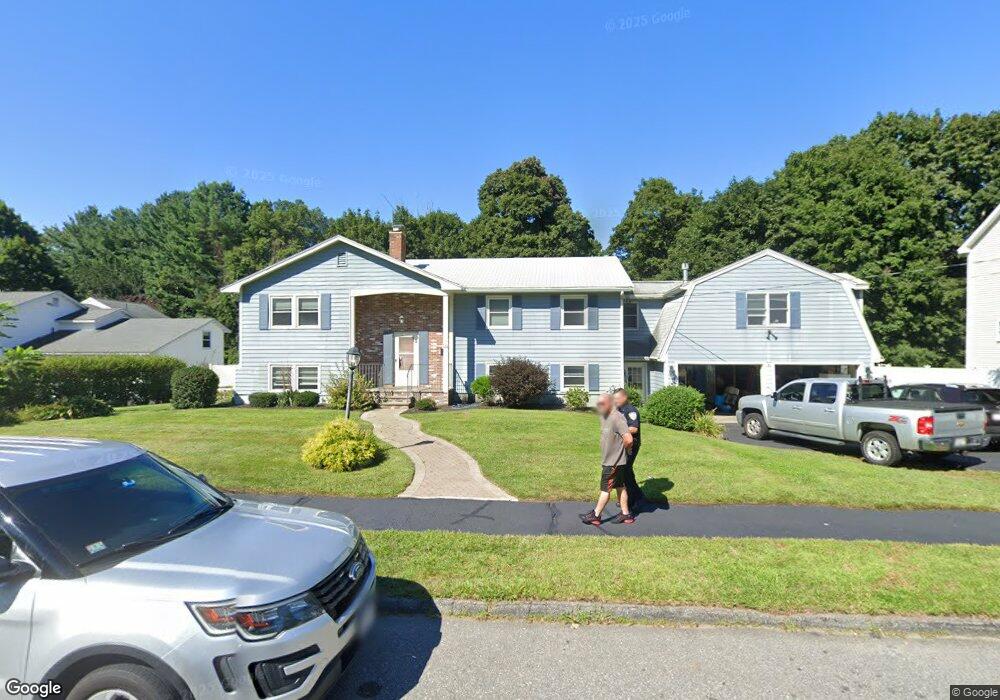
18 Julio Dr Shrewsbury, MA 01545
Estimated Value: $736,000 - $1,098,575
4
Beds
3
Baths
2,058
Sq Ft
$436/Sq Ft
Est. Value
About This Home
This home is located at 18 Julio Dr, Shrewsbury, MA 01545 and is currently estimated at $897,394, approximately $436 per square foot. 18 Julio Dr is a home located in Worcester County with nearby schools including Floral Street School, Sherwood Middle School, and Oak Middle School.
Ownership History
Date
Name
Owned For
Owner Type
Purchase Details
Closed on
Mar 15, 2024
Sold by
Robitaille Brian M and Robitaille Stephen M
Bought by
Robitaille Brian M and Robitaille Jason M
Current Estimated Value
Home Financials for this Owner
Home Financials are based on the most recent Mortgage that was taken out on this home.
Original Mortgage
$240,000
Outstanding Balance
$236,112
Interest Rate
6.77%
Mortgage Type
New Conventional
Estimated Equity
$661,282
Purchase Details
Closed on
Oct 24, 2017
Sold by
Robitaille Ernest R and Robitaille Barbara J
Bought by
Robitaille
Purchase Details
Closed on
Jul 1, 1987
Sold by
Haskell E David
Bought by
Robitaille Ernest R
Create a Home Valuation Report for This Property
The Home Valuation Report is an in-depth analysis detailing your home's value as well as a comparison with similar homes in the area
Home Values in the Area
Average Home Value in this Area
Purchase History
| Date | Buyer | Sale Price | Title Company |
|---|---|---|---|
| Robitaille Brian M | -- | None Available | |
| Robitaille Brian M | -- | None Available | |
| Robitaille Brian M | -- | None Available | |
| Robitaille Brian M | -- | None Available | |
| Robitaille Brian M | -- | None Available | |
| Robitaille | -- | -- | |
| Robitaille | -- | -- | |
| Robitaille | -- | -- | |
| Robitaille Ernest R | $178,000 | -- |
Source: Public Records
Mortgage History
| Date | Status | Borrower | Loan Amount |
|---|---|---|---|
| Open | Robitaille Brian M | $240,000 | |
| Closed | Robitaille Brian M | $240,000 | |
| Previous Owner | Robitaille Ernest R | $133,150 | |
| Previous Owner | Robitaille Ernest R | $50,000 |
Source: Public Records
Tax History Compared to Growth
Tax History
| Year | Tax Paid | Tax Assessment Tax Assessment Total Assessment is a certain percentage of the fair market value that is determined by local assessors to be the total taxable value of land and additions on the property. | Land | Improvement |
|---|---|---|---|---|
| 2025 | $96 | $800,500 | $256,100 | $544,400 |
| 2024 | $9,149 | $739,000 | $243,900 | $495,100 |
| 2023 | $8,309 | $633,300 | $243,900 | $389,400 |
| 2022 | $8,225 | $582,900 | $243,900 | $339,000 |
| 2021 | $6,987 | $529,700 | $195,100 | $334,600 |
| 2020 | $6,180 | $495,600 | $195,100 | $300,500 |
| 2019 | $5,924 | $471,300 | $178,400 | $292,900 |
| 2018 | $5,440 | $470,300 | $169,900 | $300,400 |
| 2017 | $5,589 | $435,600 | $153,900 | $281,700 |
| 2016 | $5,244 | $403,400 | $143,900 | $259,500 |
| 2015 | $5,159 | $390,800 | $137,900 | $252,900 |
Source: Public Records
Map
Nearby Homes