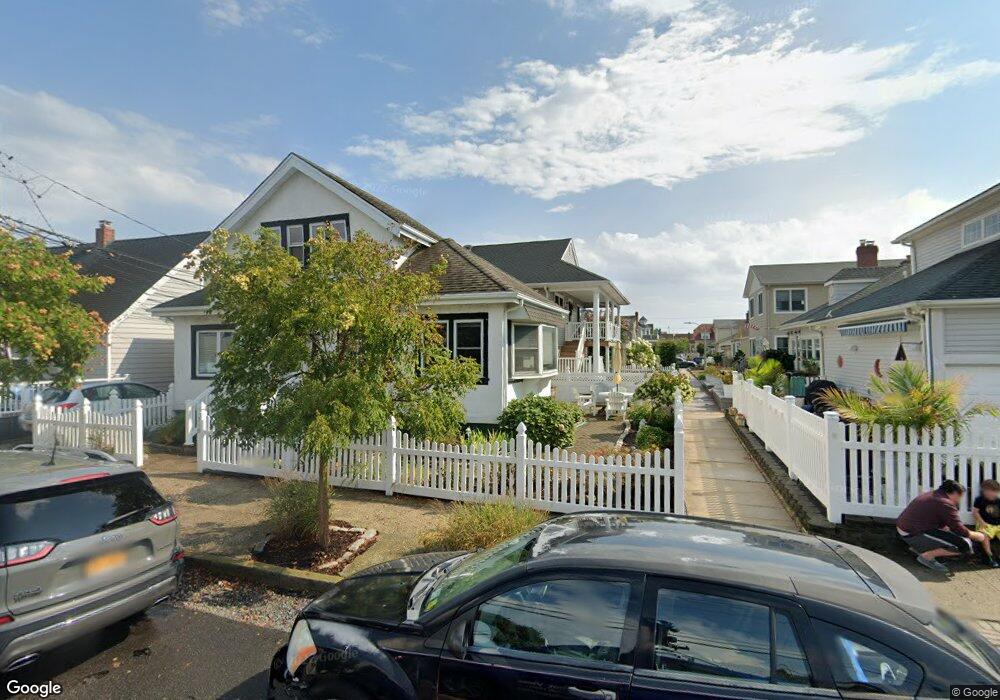
18 June Walk Long Beach, NY 11561
Estimated Value: $769,904 - $815,000
3
Beds
2
Baths
1,116
Sq Ft
$710/Sq Ft
Est. Value
About This Home
This home is located at 18 June Walk, Long Beach, NY 11561 and is currently estimated at $792,452, approximately $710 per square foot. 18 June Walk is a home located in Nassau County with nearby schools including Lido Elementary School, Lindell Elementary School, and West Elementary School.
Ownership History
Date
Name
Owned For
Owner Type
Purchase Details
Closed on
Mar 29, 2022
Sold by
Barnaby Deane M and Barnaby Brenda K
Bought by
Nicaj Tara and Kilmurray Olivia
Current Estimated Value
Home Financials for this Owner
Home Financials are based on the most recent Mortgage that was taken out on this home.
Original Mortgage
$495,500
Outstanding Balance
$431,004
Interest Rate
4.16%
Mortgage Type
New Conventional
Estimated Equity
$361,448
Purchase Details
Closed on
Mar 2, 2018
Sold by
Wilsusen Michelle and Wilsusen Sean R
Bought by
Barnaby Deane M and Barnaby Brenda K
Home Financials for this Owner
Home Financials are based on the most recent Mortgage that was taken out on this home.
Original Mortgage
$512,000
Interest Rate
4.22%
Mortgage Type
New Conventional
Purchase Details
Closed on
Jul 27, 2010
Sold by
Wilsusen Sean R
Bought by
Wilsusen Sean R and Wilsusen Michelle
Home Financials for this Owner
Home Financials are based on the most recent Mortgage that was taken out on this home.
Original Mortgage
$6,259
Interest Rate
4.63%
Mortgage Type
Purchase Money Mortgage
Purchase Details
Closed on
Feb 4, 2007
Sold by
Wilsusen Sean
Bought by
Wilsusen Sean
Purchase Details
Closed on
Jun 30, 2006
Sold by
Walsh Thomas
Bought by
Wilsusen Sean
Create a Home Valuation Report for This Property
The Home Valuation Report is an in-depth analysis detailing your home's value as well as a comparison with similar homes in the area
Home Values in the Area
Average Home Value in this Area
Purchase History
| Date | Buyer | Sale Price | Title Company |
|---|---|---|---|
| Nicaj Tara | $228,904 | Judicial Title | |
| Barnaby Deane M | $640,000 | First American Title | |
| Wilsusen Sean R | -- | -- | |
| Wilsusen Sean | -- | -- | |
| Wilsusen Sean | $370,000 | -- |
Source: Public Records
Mortgage History
| Date | Status | Borrower | Loan Amount |
|---|---|---|---|
| Open | Nicaj Tara | $495,500 | |
| Previous Owner | Barnaby Deane M | $512,000 | |
| Previous Owner | Wilsusen Sean R | $6,259 |
Source: Public Records
Tax History
| Year | Tax Paid | Tax Assessment Tax Assessment Total Assessment is a certain percentage of the fair market value that is determined by local assessors to be the total taxable value of land and additions on the property. | Land | Improvement |
|---|---|---|---|---|
| 2025 | $7,358 | $511 | $154 | $357 |
| 2024 | $871 | $498 | $194 | $304 |
Source: Public Records
Map
Nearby Homes
- 8 July Walk
- 3 September Walk
- 101 California St
- 781 W Park Ave
- 84 Nebraska St
- 821 W Park Ave
- 92 Nebraska St
- 77 Nebraska St
- 615 W Walnut St
- 853 W Park Ave
- 90 Oregon St
- 661 W Broadway Unit 403
- 661 W Broadway Unit 303
- 661 W Broadway Unit 503
- 661 W Broadway Unit 204
- 661 W Broadway Unit 203
- 730 W Broadway Unit 2J
- 56 Oregon St
- 624 W Beech St
- 59 Delaware Ave
Your Personal Tour Guide
Ask me questions while you tour the home.