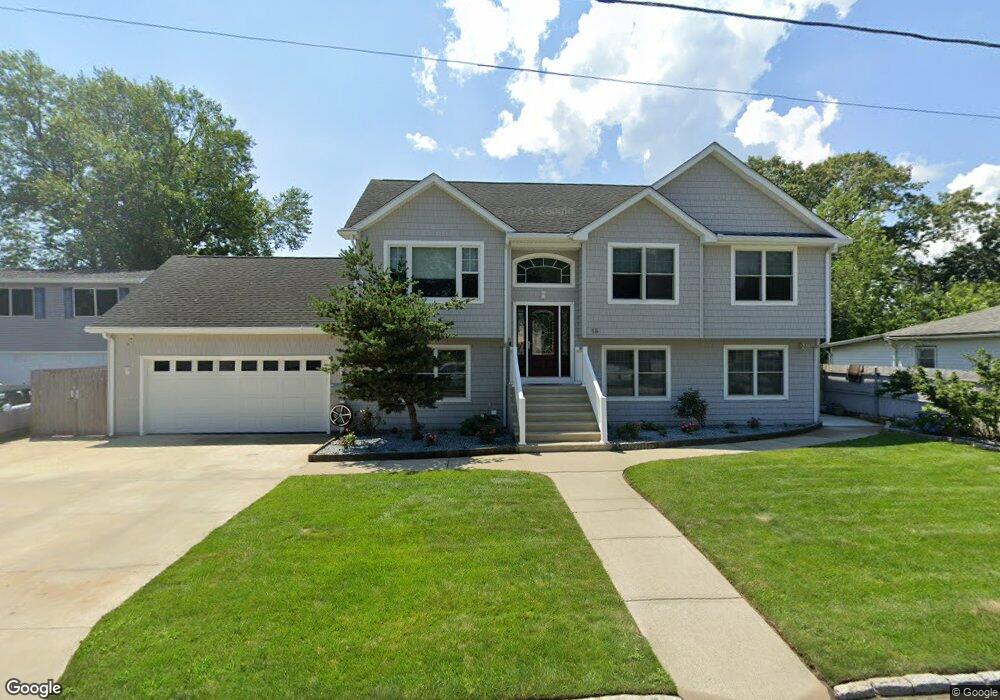
18 Kenway Ave Warwick, RI 02889
Oakland Beach NeighborhoodEstimated Value: $483,000 - $583,000
3
Beds
3
Baths
2,524
Sq Ft
$211/Sq Ft
Est. Value
About This Home
This home is located at 18 Kenway Ave, Warwick, RI 02889 and is currently estimated at $532,421, approximately $210 per square foot. 18 Kenway Ave is a home located in Kent County with nearby schools including Saint Kevin School and Bishop Hendricken High School.
Ownership History
Date
Name
Owned For
Owner Type
Purchase Details
Closed on
Feb 10, 2026
Sold by
Delangelo Joanne M
Bought by
Delangelo Joanne M and Leal Terry A
Current Estimated Value
Purchase Details
Closed on
Jul 16, 2025
Sold by
Leal Terry A
Bought by
Delangelo Joanne M
Purchase Details
Closed on
Sep 9, 2002
Sold by
Stender Frank C
Bought by
Pariseau Douglas A and Pariseau Terry A
Create a Home Valuation Report for This Property
The Home Valuation Report is an in-depth analysis detailing your home's value as well as a comparison with similar homes in the area
Home Values in the Area
Average Home Value in this Area
Purchase History
| Date | Buyer | Sale Price | Title Company |
|---|---|---|---|
| Delangelo Joanne M | -- | -- | |
| Delangelo Joanne M | -- | -- | |
| Delangelo Joanne M | -- | -- | |
| Pariseau Douglas A | $12,000 | -- | |
| Pariseau Douglas A | $12,000 | -- |
Source: Public Records
Mortgage History
| Date | Status | Borrower | Loan Amount |
|---|---|---|---|
| Previous Owner | Pariseau Douglas A | $190,000 | |
| Previous Owner | Pariseau Douglas A | $150,000 |
Source: Public Records
Tax History
| Year | Tax Paid | Tax Assessment Tax Assessment Total Assessment is a certain percentage of the fair market value that is determined by local assessors to be the total taxable value of land and additions on the property. | Land | Improvement |
|---|---|---|---|---|
| 2025 | $6,311 | $496,900 | $99,700 | $397,200 |
| 2024 | $6,435 | $444,700 | $86,700 | $358,000 |
| 2023 | $6,124 | $431,600 | $86,700 | $344,900 |
| 2022 | $5,812 | $310,300 | $50,800 | $259,500 |
| 2021 | $5,812 | $310,300 | $50,800 | $259,500 |
| 2020 | $5,812 | $310,300 | $50,800 | $259,500 |
| 2019 | $5,812 | $310,300 | $50,800 | $259,500 |
| 2018 | $5,356 | $257,500 | $50,800 | $206,700 |
| 2017 | $5,212 | $257,500 | $50,800 | $206,700 |
| 2016 | $5,212 | $257,500 | $50,800 | $206,700 |
| 2015 | $4,837 | $233,100 | $56,000 | $177,100 |
| 2014 | $4,676 | $233,100 | $56,000 | $177,100 |
| 2013 | $4,613 | $233,100 | $56,000 | $177,100 |
Source: Public Records
Map
Nearby Homes
- 357 Pequot Ave
- 83 Ottawa Ave
- 107 Coburn St
- 52 Hazard Ave
- 90 Huron St
- 75 Northup St
- 0 Sea View Dr
- 79 Suburban Pkwy
- 73 Pinehurst Ave
- 71 Pinehurst Ave
- 79 Pinehurst Ave
- 81 Pinehurst Ave
- 188 Wood St
- 21 Hampton Ave
- 585 Meadow View Ave
- 176 Canfield Ave
- 165 Canfield Ave
- 195 Oakland Beach Ave
- 43 Beaver Ave
- 30 White Rock Rd
- 22 Kenway Ave
- 26 Kenway Ave
- 295 Pequot Ave
- 23 Kenway Ave
- 638 Oakland Beach Ave
- 15 Wilson Ave
- 285 Pequot Ave
- 644 Oakland Beach Ave
- 21 Wilson Ave
- 315 Pequot Ave
- 279 Pequot Ave
- 652 Oakland Beach Ave
- 80 Coburn St
- 66 Coburn St
- 618 Oakland Beach Ave
- 56 Coburn St
- 288 Pequot Ave
- 304 Pequot Ave
- 14 Wilson Ave
- 612 Oakland Beach Ave
Your Personal Tour Guide
Ask me questions while you tour the home.