18 Kory Rd Newton, NJ 07860
Estimated Value: $414,000 - $440,000
--
Bed
--
Bath
1,440
Sq Ft
$296/Sq Ft
Est. Value
About This Home
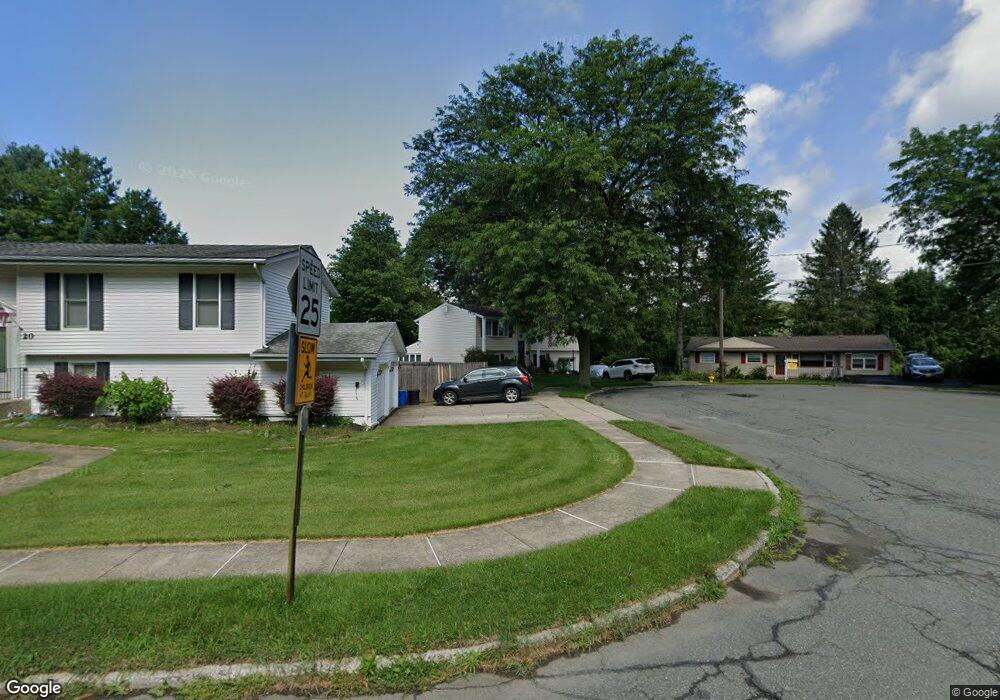
This home is located at 18 Kory Rd, Newton, NJ 07860 and is currently estimated at $426,747, approximately $296 per square foot. 18 Kory Rd is a home located in Sussex County with nearby schools including Merriam Avenue School, Halsted Street Middle School, and Newton High School.
Ownership History
Date
Name
Owned For
Owner Type
Purchase Details
Closed on
Aug 21, 1997
Sold by
Rankin Anna C
Bought by
Robbins Daniel L and Robbins Janet L
Current Estimated Value
Home Financials for this Owner
Home Financials are based on the most recent Mortgage that was taken out on this home.
Original Mortgage
$132,925
Outstanding Balance
$19,714
Interest Rate
7.42%
Mortgage Type
FHA
Estimated Equity
$407,033
Create a Home Valuation Report for This Property
The Home Valuation Report is an in-depth analysis detailing your home's value as well as a comparison with similar homes in the area
Home Values in the Area
Average Home Value in this Area
Purchase History
| Date | Buyer | Sale Price | Title Company |
|---|---|---|---|
| Robbins Daniel L | $135,000 | -- |
Source: Public Records
Mortgage History
| Date | Status | Borrower | Loan Amount |
|---|---|---|---|
| Open | Robbins Daniel L | $132,925 |
Source: Public Records
Tax History Compared to Growth
Tax History
| Year | Tax Paid | Tax Assessment Tax Assessment Total Assessment is a certain percentage of the fair market value that is determined by local assessors to be the total taxable value of land and additions on the property. | Land | Improvement |
|---|---|---|---|---|
| 2025 | $9,187 | $364,900 | $119,300 | $245,600 |
| 2024 | $9,087 | $336,900 | $96,100 | $240,800 |
| 2023 | $9,087 | $202,200 | $71,100 | $131,100 |
| 2022 | $9,123 | $202,200 | $71,100 | $131,100 |
| 2021 | $9,083 | $202,200 | $71,100 | $131,100 |
| 2020 | $8,943 | $202,200 | $71,100 | $131,100 |
| 2019 | $8,666 | $202,200 | $71,100 | $131,100 |
| 2018 | $8,620 | $202,200 | $71,100 | $131,100 |
| 2017 | $8,569 | $202,200 | $71,100 | $131,100 |
| 2016 | $8,432 | $202,200 | $71,100 | $131,100 |
| 2015 | $8,209 | $202,200 | $71,100 | $131,100 |
| 2014 | $8,039 | $202,200 | $71,100 | $131,100 |
Source: Public Records
Map
Nearby Homes
- 14 Trenton Place
- 30 Linmor Ave
- 66 Paterson Ave
- 63 Merriam Ave
- 36 Paterson Ave
- 46 Orchard St Unit 2
- 103 Woodside Ave
- 46 Pine St
- 21 Gregg Ct
- 18 Joseph Dr
- 19 Gregg Ct
- 76 Carriage Ln Unit 76
- 8 Orchard St
- 40 Carriage Ln Unit 40
- 0 W Nelson St
- 18 Lincoln Place
- 21 Carriage Ln Unit 21
- 22 Woodside Ave
- 41 Plainfield Ave
- 219 Woodside Ave