18 Lakeview Dr Freeburg, IL 62243
Estimated Value: $197,420 - $244,000
--
Bed
--
Bath
1,605
Sq Ft
$137/Sq Ft
Est. Value
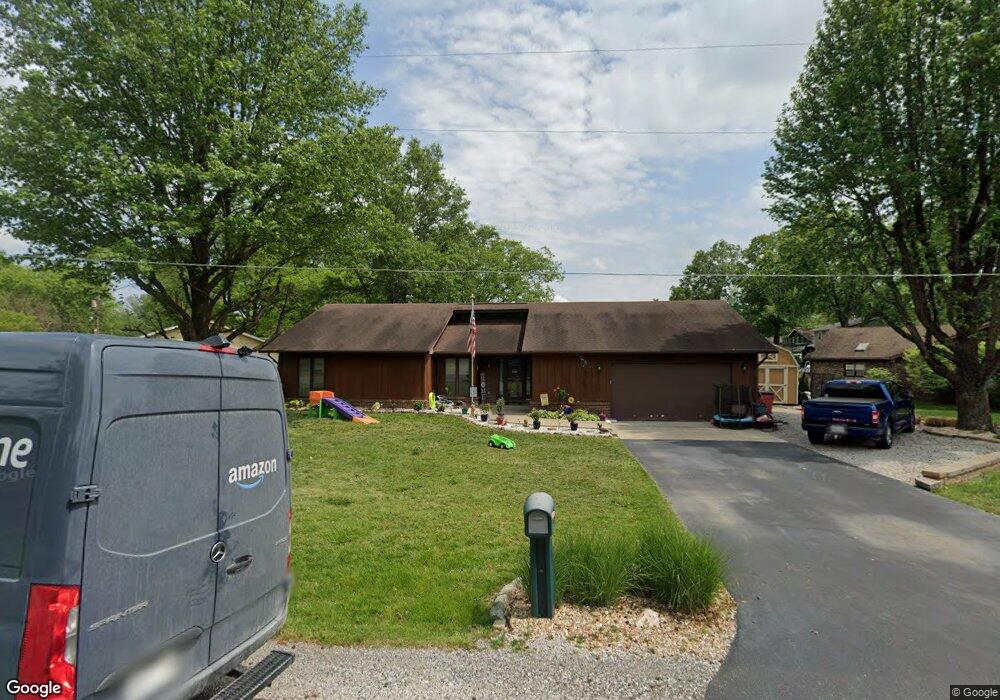
About This Home
This home is located at 18 Lakeview Dr, Freeburg, IL 62243 and is currently estimated at $219,855, approximately $136 per square foot. 18 Lakeview Dr is a home located in St. Clair County with nearby schools including Freeburg Elementary School, Freeburg Community High School, and St. Joseph Catholic School.
Ownership History
Date
Name
Owned For
Owner Type
Purchase Details
Closed on
Dec 3, 2018
Sold by
Wilderman Timothy L
Bought by
Wilderman James Timothy and Wilderman Anna Marie
Current Estimated Value
Home Financials for this Owner
Home Financials are based on the most recent Mortgage that was taken out on this home.
Original Mortgage
$115,000
Outstanding Balance
$103,370
Interest Rate
5.87%
Mortgage Type
New Conventional
Estimated Equity
$116,485
Purchase Details
Closed on
Jun 26, 2002
Sold by
Wilderman Timothy L and Farley Donna C
Bought by
Wilderman Timothy L
Home Financials for this Owner
Home Financials are based on the most recent Mortgage that was taken out on this home.
Original Mortgage
$133,900
Interest Rate
6.93%
Mortgage Type
Purchase Money Mortgage
Purchase Details
Closed on
Jun 1, 1997
Bought by
Wilderman Timothy L
Create a Home Valuation Report for This Property
The Home Valuation Report is an in-depth analysis detailing your home's value as well as a comparison with similar homes in the area
Home Values in the Area
Average Home Value in this Area
Purchase History
| Date | Buyer | Sale Price | Title Company |
|---|---|---|---|
| Wilderman James Timothy | $40,000 | Clear Title Group Llc | |
| Wilderman Timothy L | -- | First American Title Insuran | |
| Wilderman Timothy L | $135,000 | -- |
Source: Public Records
Mortgage History
| Date | Status | Borrower | Loan Amount |
|---|---|---|---|
| Open | Wilderman James Timothy | $115,000 | |
| Previous Owner | Wilderman Timothy L | $133,900 |
Source: Public Records
Tax History Compared to Growth
Tax History
| Year | Tax Paid | Tax Assessment Tax Assessment Total Assessment is a certain percentage of the fair market value that is determined by local assessors to be the total taxable value of land and additions on the property. | Land | Improvement |
|---|---|---|---|---|
| 2024 | $4,026 | $54,146 | $10,434 | $43,712 |
| 2023 | $3,498 | $47,253 | $10,070 | $37,183 |
| 2022 | $3,317 | $44,275 | $9,434 | $34,841 |
| 2021 | $3,182 | $41,683 | $8,882 | $32,801 |
| 2020 | $3,012 | $37,922 | $8,081 | $29,841 |
| 2019 | $2,947 | $38,819 | $8,353 | $30,466 |
| 2018 | $2,891 | $38,306 | $8,243 | $30,063 |
| 2017 | $2,746 | $36,624 | $7,881 | $28,743 |
| 2016 | $2,708 | $35,100 | $7,553 | $27,547 |
| 2014 | $2,372 | $34,971 | $7,750 | $27,221 |
| 2013 | $2,177 | $34,659 | $7,681 | $26,978 |
Source: Public Records
Map
Nearby Homes
- 3 Park St
- 0 Hickory Dr
- 109 Willow Dr
- 111 Willow Dr
- 103 Draco Dr
- 106 S Vine St
- 207 N Edison St
- 401 N Edison St
- 520 N Edison St
- 312 W Phillips St
- 206 N Main St
- tbb Illinois 15
- 302 N Railroad St
- 420 Foxtail Dr
- 440 Foxtail Dr
- 433 Foxtail Dr
- 304 Torrington Ln
- 359 Sleeping Indian Dr
- 363 Sleeping Indian Dr
- 222 Alamosa Dr