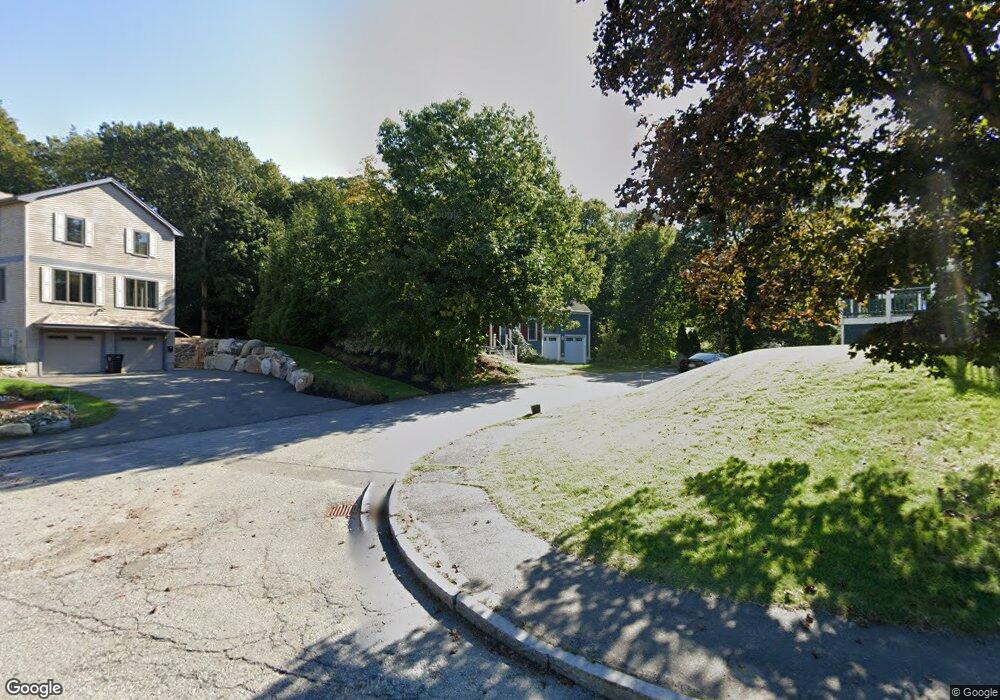
18 Lamoine St Belmont, MA 02478
Belmont Hill NeighborhoodEstimated Value: $2,213,000 - $2,316,000
6
Beds
5
Baths
2,930
Sq Ft
$767/Sq Ft
Est. Value
About This Home
This home is located at 18 Lamoine St, Belmont, MA 02478 and is currently estimated at $2,246,509, approximately $766 per square foot. 18 Lamoine St is a home located in Middlesex County with nearby schools including Winn Brook Elementary School, Winthrop L Chenery Middle School, and Belmont High School.
Ownership History
Date
Name
Owned For
Owner Type
Purchase Details
Closed on
Jul 11, 2019
Sold by
Hawkinson Lowell B Est
Bought by
Hawkinson Lillian V
Current Estimated Value
Purchase Details
Closed on
May 8, 2019
Sold by
Hawkinson Laura E
Bought by
Hawkinson Lilian C
Purchase Details
Closed on
May 30, 2003
Sold by
Freedom Dev Constr Cor
Bought by
Hawkinson Lowell B
Home Financials for this Owner
Home Financials are based on the most recent Mortgage that was taken out on this home.
Original Mortgage
$322,700
Interest Rate
5.86%
Mortgage Type
Purchase Money Mortgage
Purchase Details
Closed on
Mar 29, 2002
Sold by
Flynn Edmund B
Bought by
Freedom Dev Constr
Home Financials for this Owner
Home Financials are based on the most recent Mortgage that was taken out on this home.
Original Mortgage
$475,000
Interest Rate
6.88%
Mortgage Type
Purchase Money Mortgage
Create a Home Valuation Report for This Property
The Home Valuation Report is an in-depth analysis detailing your home's value as well as a comparison with similar homes in the area
Home Values in the Area
Average Home Value in this Area
Purchase History
| Date | Buyer | Sale Price | Title Company |
|---|---|---|---|
| Hawkinson Lillian V | -- | -- | |
| Hawkinson Lilian C | -- | -- | |
| Hawkinson Lowell B | $830,000 | -- | |
| Freedom Dev Constr | $310,000 | -- |
Source: Public Records
Mortgage History
| Date | Status | Borrower | Loan Amount |
|---|---|---|---|
| Previous Owner | Hawkinson Lowell B | $322,700 | |
| Previous Owner | Freedom Dev Constr | $475,000 |
Source: Public Records
Tax History Compared to Growth
Tax History
| Year | Tax Paid | Tax Assessment Tax Assessment Total Assessment is a certain percentage of the fair market value that is determined by local assessors to be the total taxable value of land and additions on the property. | Land | Improvement |
|---|---|---|---|---|
| 2025 | $24,204 | $2,125,000 | $769,000 | $1,356,000 |
| 2024 | $21,162 | $2,004,000 | $905,000 | $1,099,000 |
| 2023 | $19,962 | $1,776,000 | $879,000 | $897,000 |
| 2022 | $19,987 | $1,685,000 | $850,000 | $835,000 |
| 2021 | $19,987 | $1,732,000 | $1,001,000 | $731,000 |
| 2020 | $16,390 | $1,490,000 | $764,000 | $726,000 |
| 2019 | $15,906 | $1,363,000 | $648,000 | $715,000 |
| 2018 | $15,516 | $1,277,000 | $562,000 | $715,000 |
| 2017 | $15,304 | $1,206,000 | $491,000 | $715,000 |
| 2016 | $15,085 | $1,201,000 | $491,000 | $710,000 |
| 2015 | $13,777 | $1,068,000 | $359,000 | $709,000 |
Source: Public Records
Map
Nearby Homes
- 24 Bellington St
- 789 Concord Turnpike
- 39 Chester St
- 170 Clifton St
- 305 Park Ave
- 221 Highland Ave
- 77 Wellesley Rd
- 152 Scituate St
- 278 Hillside Ave
- 53 Crestview Rd
- 11 Stevens Terrace
- 10 Stevens Terrace
- 135 Marsh St
- 50 Hathaway Cir
- 18 Morton Rd
- 72 Hathaway Cir
- 51 Stella Rd
- 10 Radcliffe Rd
- 141 Renfrew St
- 39 Birch Hill Rd