Estimated Value: $560,086 - $772,000
--
Bed
--
Bath
--
Sq Ft
7,841
Sq Ft Lot
About This Home
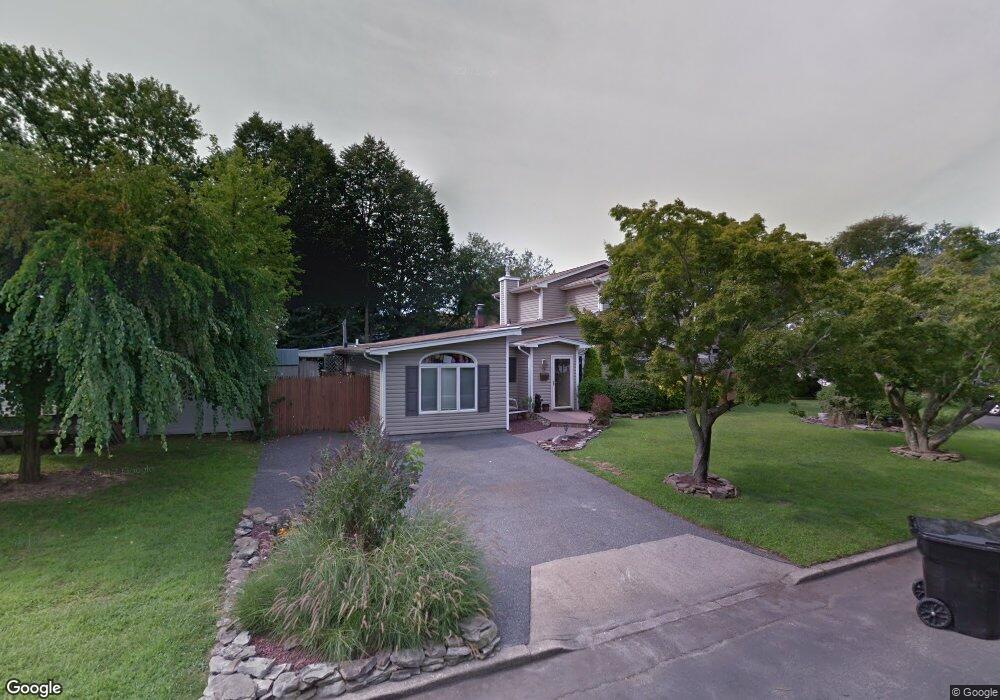
This home is located at 18 Langdon St, Islip, NY 11751 and is currently estimated at $706,522. 18 Langdon St is a home located in Suffolk County with nearby schools including Wing Elementary School, Islip Middle School, and Islip High School.
Ownership History
Date
Name
Owned For
Owner Type
Purchase Details
Closed on
May 11, 2001
Sold by
Nicotra Victor and Nicotra Adriana
Bought by
Widecki Kevin R and Widecki Stephanie
Current Estimated Value
Home Financials for this Owner
Home Financials are based on the most recent Mortgage that was taken out on this home.
Original Mortgage
$173,000
Outstanding Balance
$64,694
Interest Rate
7.05%
Estimated Equity
$641,828
Create a Home Valuation Report for This Property
The Home Valuation Report is an in-depth analysis detailing your home's value as well as a comparison with similar homes in the area
Home Values in the Area
Average Home Value in this Area
Purchase History
| Date | Buyer | Sale Price | Title Company |
|---|---|---|---|
| Widecki Kevin R | $193,000 | Fidelity National Title Ins |
Source: Public Records
Mortgage History
| Date | Status | Borrower | Loan Amount |
|---|---|---|---|
| Open | Widecki Kevin R | $173,000 |
Source: Public Records
Tax History Compared to Growth
Tax History
| Year | Tax Paid | Tax Assessment Tax Assessment Total Assessment is a certain percentage of the fair market value that is determined by local assessors to be the total taxable value of land and additions on the property. | Land | Improvement |
|---|---|---|---|---|
| 2024 | $11,960 | $39,600 | $6,800 | $32,800 |
| 2023 | $11,960 | $39,600 | $6,800 | $32,800 |
| 2022 | $10,629 | $39,600 | $6,800 | $32,800 |
| 2021 | $10,629 | $39,600 | $6,800 | $32,800 |
| 2020 | $11,401 | $39,600 | $6,800 | $32,800 |
| 2019 | $10,629 | $0 | $0 | $0 |
| 2018 | -- | $39,600 | $6,800 | $32,800 |
| 2017 | $10,699 | $39,600 | $6,800 | $32,800 |
| 2016 | $10,695 | $39,600 | $6,800 | $32,800 |
| 2015 | -- | $39,600 | $6,800 | $32,800 |
| 2014 | -- | $39,600 | $6,800 | $32,800 |
Source: Public Records
Map
Nearby Homes