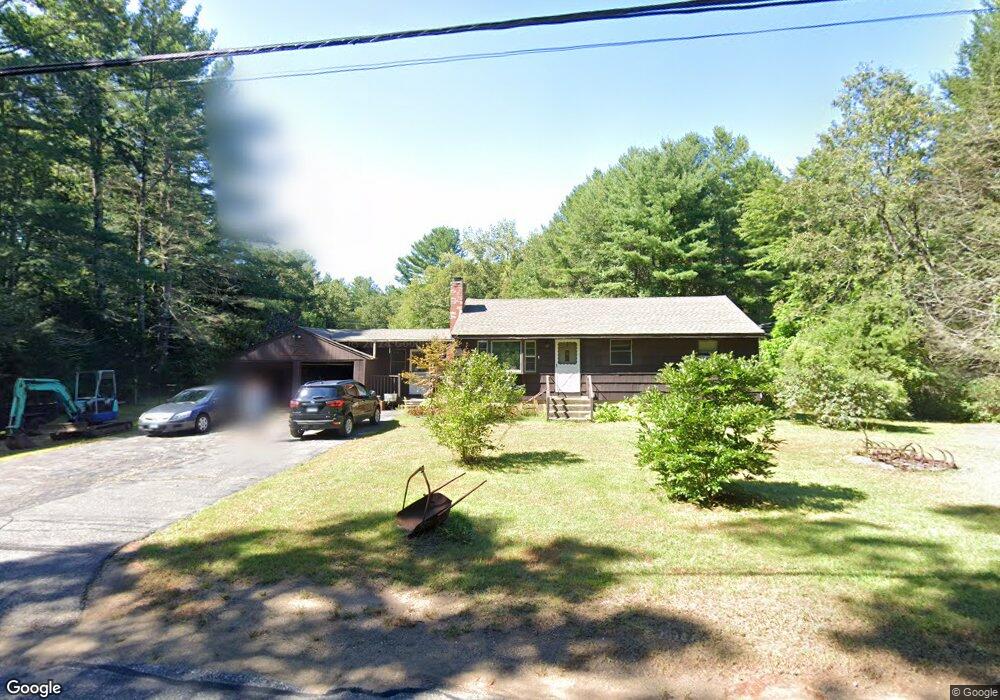
18 Latham Rd Willington, CT 06279
Estimated Value: $227,000 - $325,000
3
Beds
1
Bath
1,108
Sq Ft
$242/Sq Ft
Est. Value
About This Home
This home is located at 18 Latham Rd, Willington, CT 06279 and is currently estimated at $267,868, approximately $241 per square foot. 18 Latham Rd is a home located in Tolland County with nearby schools including Center Elementary School, Hall Memorial School, and E.O. Smith High School.
Ownership History
Date
Name
Owned For
Owner Type
Purchase Details
Closed on
Aug 12, 2021
Sold by
Semmelrock Dawn
Bought by
Semmelrock Jeffrey S
Current Estimated Value
Purchase Details
Closed on
Aug 3, 2015
Sold by
Hainline Julianne G
Bought by
Semmelrock Jeffrey S and Semmelrock Dawn
Home Financials for this Owner
Home Financials are based on the most recent Mortgage that was taken out on this home.
Original Mortgage
$93,672
Interest Rate
3.97%
Mortgage Type
FHA
Create a Home Valuation Report for This Property
The Home Valuation Report is an in-depth analysis detailing your home's value as well as a comparison with similar homes in the area
Home Values in the Area
Average Home Value in this Area
Purchase History
| Date | Buyer | Sale Price | Title Company |
|---|---|---|---|
| Semmelrock Jeffrey S | -- | None Available | |
| Semmelrock Jeffrey S | -- | None Available | |
| Semmelrock Jeffrey S | $95,400 | -- | |
| Semmelrock Jeffrey S | $95,400 | -- |
Source: Public Records
Mortgage History
| Date | Status | Borrower | Loan Amount |
|---|---|---|---|
| Previous Owner | Semmelrock Jeffrey S | $110,950 | |
| Previous Owner | Semmelrock Jeffrey S | $93,672 |
Source: Public Records
Tax History
| Year | Tax Paid | Tax Assessment Tax Assessment Total Assessment is a certain percentage of the fair market value that is determined by local assessors to be the total taxable value of land and additions on the property. | Land | Improvement |
|---|---|---|---|---|
| 2025 | $3,915 | $154,030 | $52,220 | $101,810 |
| 2024 | $3,822 | $112,790 | $33,840 | $78,950 |
| 2023 | $3,627 | $112,790 | $33,840 | $78,950 |
| 2022 | $3,527 | $112,790 | $33,840 | $78,950 |
| 2021 | $3,383 | $112,790 | $33,840 | $78,950 |
| 2020 | $3,383 | $112,790 | $33,840 | $78,950 |
| 2019 | $3,394 | $112,790 | $33,840 | $78,950 |
| 2018 | $3,461 | $115,030 | $43,390 | $71,640 |
| 2017 | $3,461 | $115,030 | $43,390 | $71,640 |
| 2015 | $3,145 | $115,030 | $43,390 | $71,640 |
| 2014 | $3,145 | $115,030 | $43,390 | $71,640 |
Source: Public Records
Map
Nearby Homes
- 57 Hall Hill Rd
- 69 Cisar Rd
- 124 River Rd
- 131 River Rd
- 10 Depot Rd Unit 15
- 23 Baxter Rd
- 167 Baxter Rd
- 1728 Stafford Rd
- 668 Middle Turnpike
- 21 Hillpond Dr
- 0 Middle Turnpike
- 1652 Stafford Rd
- 151 Walbridge Hill Rd
- 42 Grandview Cir
- 0 Merrow Rd Unit 24141193
- 292 Tolland Turnpike
- 45 Crystal Ln Unit D
- 166 Anthony Rd
- 159 Anthony Rd
- 0 Tolland Stage Rd Unit 24101836
- 16 Latham Rd
- 22 Latham Rd
- 12 Latham Rd
- 7 Latham Rd
- 6 Latham Rd
- 2 Latham Rd
- 25 Latham Rd
- 57 Pinney Hill Rd
- 46 Pinney Hill Rd
- 43 Pinney Hill Rd
- 58 Pinney Hill Rd
- 52 Pinney Hill Rd
- 31 Latham Rd
- 59 Pinney Hill Rd
- 42 Pinney Hill Rd
- 61 Pinney Hill Rd
- 54 Pinney Hill Rd
- 39 Pinney Hill Rd
- 65 Pinney Hill Rd
- 64 Pinney Hill Rd
Your Personal Tour Guide
Ask me questions while you tour the home.