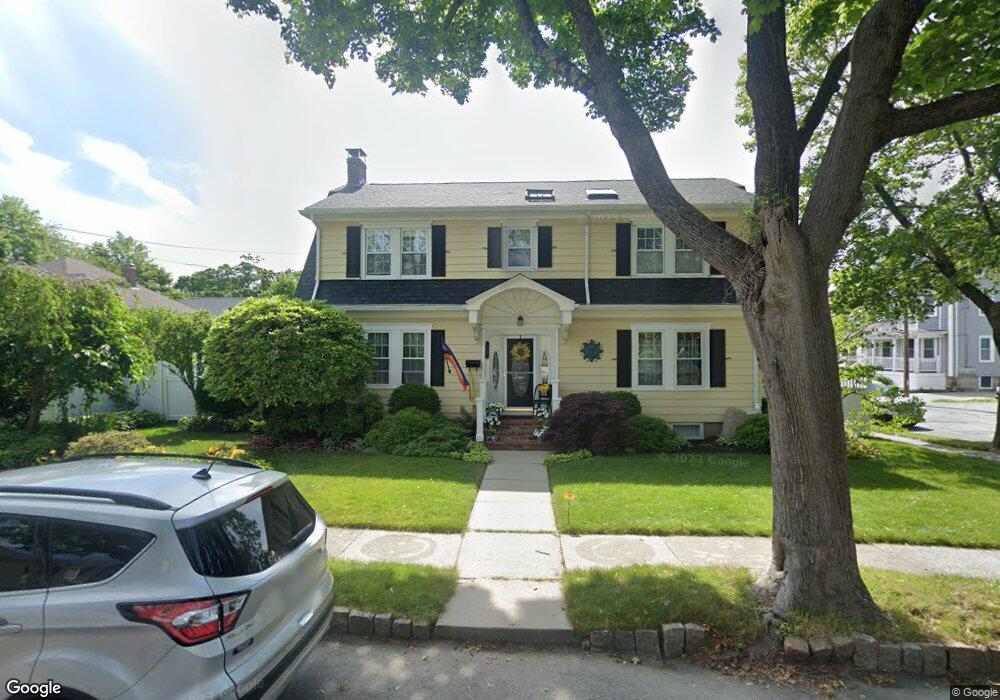
18 Laurel St Fairhaven, MA 02719
Estimated Value: $590,302 - $720,000
4
Beds
2
Baths
2,171
Sq Ft
$298/Sq Ft
Est. Value
About This Home
This home is located at 18 Laurel St, Fairhaven, MA 02719 and is currently estimated at $646,076, approximately $297 per square foot. 18 Laurel St is a home located in Bristol County with nearby schools including Fairhaven High School, City On A Hill Charter Public School New Bedford, and St. Joseph School.
Ownership History
Date
Name
Owned For
Owner Type
Purchase Details
Closed on
Oct 13, 2006
Sold by
Raikkonen John O and Raikkonen Paula A
Bought by
Wojcik Debra J and Wojcik Edward
Current Estimated Value
Home Financials for this Owner
Home Financials are based on the most recent Mortgage that was taken out on this home.
Original Mortgage
$170,000
Outstanding Balance
$101,498
Interest Rate
6.47%
Mortgage Type
Purchase Money Mortgage
Estimated Equity
$544,578
Create a Home Valuation Report for This Property
The Home Valuation Report is an in-depth analysis detailing your home's value as well as a comparison with similar homes in the area
Home Values in the Area
Average Home Value in this Area
Purchase History
| Date | Buyer | Sale Price | Title Company |
|---|---|---|---|
| Wojcik Debra J | $359,000 | -- |
Source: Public Records
Mortgage History
| Date | Status | Borrower | Loan Amount |
|---|---|---|---|
| Open | Wojcik Debra J | $170,000 | |
| Closed | Wojcik Debra J | $100,000 | |
| Previous Owner | Wojcik Debra J | $155,000 |
Source: Public Records
Tax History Compared to Growth
Tax History
| Year | Tax Paid | Tax Assessment Tax Assessment Total Assessment is a certain percentage of the fair market value that is determined by local assessors to be the total taxable value of land and additions on the property. | Land | Improvement |
|---|---|---|---|---|
| 2025 | $46 | $490,200 | $179,300 | $310,900 |
| 2024 | $4,597 | $498,000 | $179,300 | $318,700 |
| 2023 | $4,540 | $456,300 | $166,200 | $290,100 |
| 2022 | $4,357 | $426,300 | $158,400 | $267,900 |
| 2021 | $4,225 | $374,200 | $144,000 | $230,200 |
| 2020 | $4,066 | $367,600 | $137,400 | $230,200 |
| 2019 | $4,007 | $343,400 | $125,100 | $218,300 |
| 2018 | $3,843 | $327,100 | $119,100 | $208,000 |
| 2017 | $5,545 | $318,100 | $119,100 | $199,000 |
| 2016 | $3,527 | $289,600 | $119,100 | $170,500 |
| 2015 | $3,372 | $277,500 | $119,100 | $158,400 |
Source: Public Records
Map
Nearby Homes