18 Laurel St Lowell, MA 01852
Belvidere NeighborhoodEstimated Value: $604,000 - $708,163
About This Home
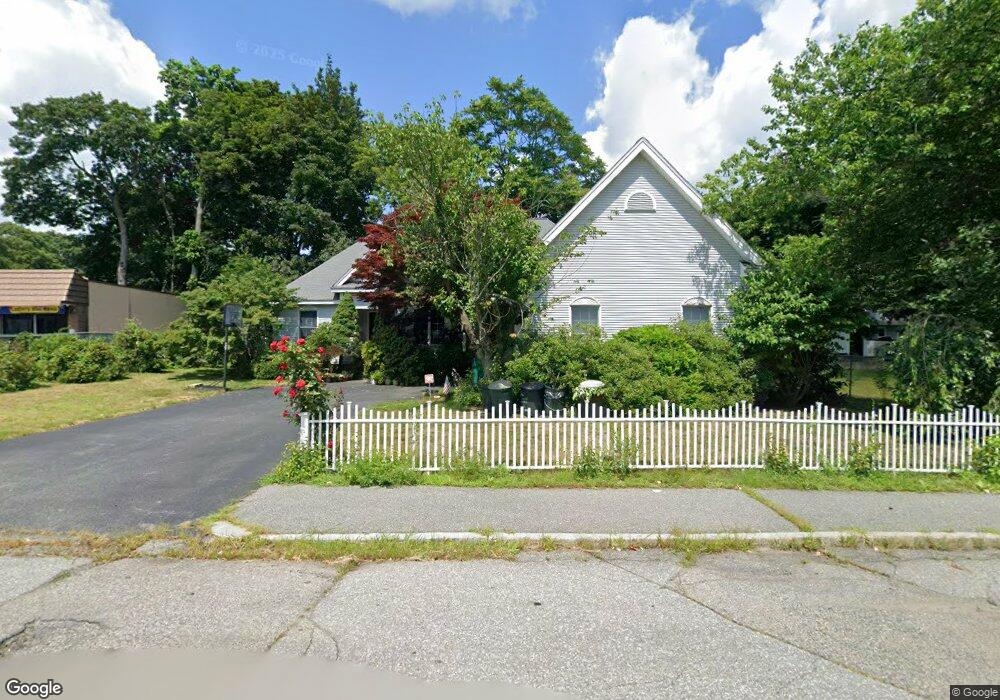
This home is located at 18 Laurel St, Lowell, MA 01852 and is currently estimated at $670,291, approximately $404 per square foot. 18 Laurel St is a home located in Middlesex County with nearby schools including Moody Elementary School, Abraham Lincoln Elementary School, and Greenhalge Elementary School.
Ownership History
We collect this data history from publicly available records. To have your information removed, we recommend requesting removal directly through your county’s website.
Purchase Details
Purchase Details
Home Financials for this Owner
Home Financials are based on the most recent Mortgage that was taken out on this home.Home Values in the Area
Average Home Value in this Area
Purchase History
We collect this data history from publicly available records. To have your information removed, we recommend requesting removal directly through your county’s website.
| Date | Buyer | Sale Price | Title Company |
|---|---|---|---|
| -- | None Available | ||
| -- | None Available | ||
| $320,000 | -- | ||
| $320,000 | -- |
Mortgage History
We collect this data history from publicly available records. To have your information removed, we recommend requesting removal directly through your county’s website.
| Date | Status | Borrower | Loan Amount |
|---|---|---|---|
| Previous Owner | $120,000 | ||
| Previous Owner | $250,000 |
Tax History
We collect this data history from publicly available records. To have your information removed, we recommend requesting removal directly through your county’s website.
| Year | Tax Paid | Tax Assessment Tax Assessment Total Assessment is a certain percentage of the fair market value that is determined by local assessors to be the total taxable value of land and additions on the property. | Land | Improvement |
|---|---|---|---|---|
| 2025 | $7,305 | $636,300 | $241,400 | $394,900 |
| 2024 | $7,076 | $594,100 | $225,600 | $368,500 |
| 2023 | $6,872 | $553,300 | $196,200 | $357,100 |
| 2022 | $6,293 | $495,900 | $178,300 | $317,600 |
| 2021 | $5,770 | $428,700 | $155,100 | $273,600 |
| 2020 | $5,685 | $425,500 | $155,100 | $270,400 |
| 2019 | $5,794 | $412,700 | $154,300 | $258,400 |
| 2018 | $5,775 | $401,300 | $146,900 | $254,400 |
| 2017 | $5,471 | $366,700 | $136,300 | $230,400 |
| 2016 | $5,333 | $351,800 | $125,400 | $226,400 |
| 2015 | $5,198 | $335,800 | $125,400 | $210,400 |
| 2013 | $4,757 | $316,900 | $138,400 | $178,500 |
Map
- 31 Sycamore St
- 239 Fairmount St
- 471 Butman Rd
- 2 Douglas Terrace
- 125 Hoyt Ave
- 18 Nob Way
- 192 Wentworth Ave
- 133 Fairmount St
- 105 Starr Ave
- 32 Belmont Ave
- 100 Roper St Unit D
- 50 Wentworth Ave
- 32A Rockingham St Unit 32A
- 224 Pleasant St Unit A
- 21 Guild St
- 25 Windward Rd
- 62 Huntington St
- 1081 Lawrence St
- 176 Pleasant St
- 116 Fort Hill Ave
Ask me questions while you tour the home.