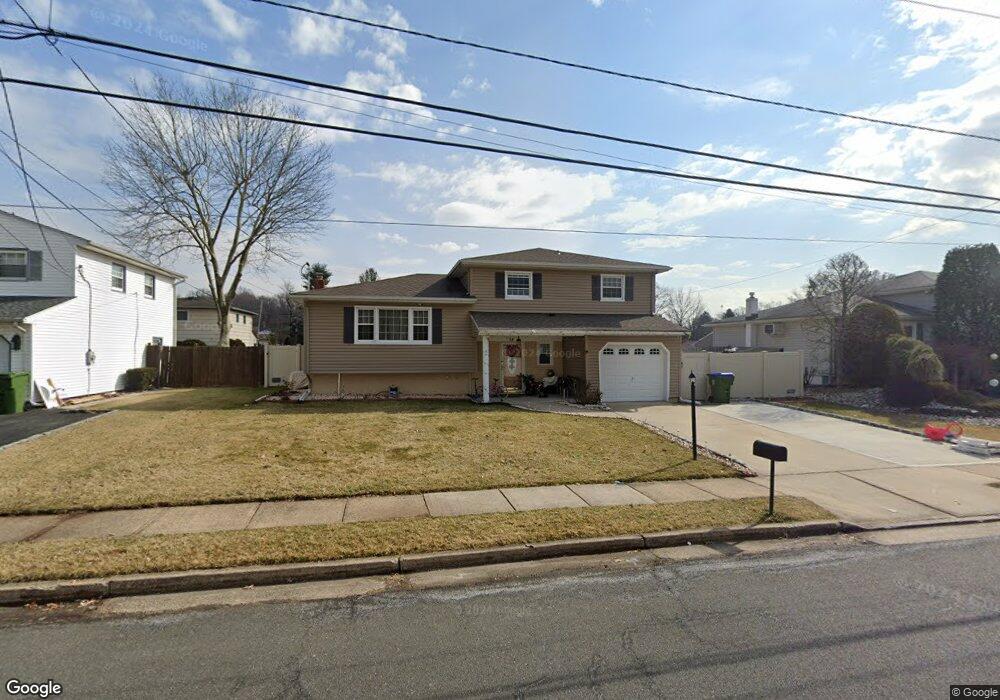
18 Lench Ave Edison, NJ 08820
Estimated Value: $729,000 - $801,000
3
Beds
2
Baths
1,654
Sq Ft
$455/Sq Ft
Est. Value
About This Home
This home is located at 18 Lench Ave, Edison, NJ 08820 and is currently estimated at $752,898, approximately $455 per square foot. 18 Lench Ave is a home located in Middlesex County with nearby schools including Menlo Park Elementary School, Woodrow Wilson Middle School, and J.P. Stevens High School.
Ownership History
Date
Name
Owned For
Owner Type
Purchase Details
Closed on
Jun 8, 2018
Sold by
Glodie John M and Dodick Helen C
Bought by
Hyder Syed Wali and Ejaz Nazia
Current Estimated Value
Home Financials for this Owner
Home Financials are based on the most recent Mortgage that was taken out on this home.
Original Mortgage
$347,200
Outstanding Balance
$298,422
Interest Rate
4.6%
Mortgage Type
New Conventional
Estimated Equity
$454,476
Purchase Details
Closed on
Aug 27, 2015
Sold by
Nordman Cindy
Bought by
Glodic John M
Create a Home Valuation Report for This Property
The Home Valuation Report is an in-depth analysis detailing your home's value as well as a comparison with similar homes in the area
Home Values in the Area
Average Home Value in this Area
Purchase History
| Date | Buyer | Sale Price | Title Company |
|---|---|---|---|
| Hyder Syed Wali | $434,000 | Wfg Natl Title Ins Co | |
| Glodic John M | -- | None Available |
Source: Public Records
Mortgage History
| Date | Status | Borrower | Loan Amount |
|---|---|---|---|
| Open | Hyder Syed Wali | $347,200 |
Source: Public Records
Tax History
| Year | Tax Paid | Tax Assessment Tax Assessment Total Assessment is a certain percentage of the fair market value that is determined by local assessors to be the total taxable value of land and additions on the property. | Land | Improvement |
|---|---|---|---|---|
| 2025 | $11,370 | $191,000 | $102,500 | $88,500 |
| 2024 | $11,309 | $191,000 | $102,500 | $88,500 |
| 2023 | $11,309 | $191,000 | $102,500 | $88,500 |
| 2022 | $11,313 | $191,000 | $102,500 | $88,500 |
| 2021 | $10,749 | $191,000 | $102,500 | $88,500 |
| 2020 | $11,172 | $191,000 | $102,500 | $88,500 |
| 2019 | $10,749 | $187,000 | $102,500 | $84,500 |
| 2018 | $10,142 | $187,000 | $102,500 | $84,500 |
| 2017 | $10,048 | $187,000 | $102,500 | $84,500 |
| 2016 | $9,866 | $187,000 | $102,500 | $84,500 |
| 2015 | $9,488 | $187,000 | $102,500 | $84,500 |
| 2014 | $9,212 | $187,000 | $102,500 | $84,500 |
Source: Public Records
Map
Nearby Homes
- 73 Christie St
- 51 Adams St
- 182 Parsonage Rd
- 177 Mundy Ave
- 21 Middlesex Ave
- 1821 Oak Tree Rd
- 22 N Oak Ave
- 48 Lynnwood Rd
- 1610 Oak Tree Rd
- 1868 Oak Tree Rd
- 3 Hummingbird Ln
- 24 Maple Rd
- 187 Evergreen Rd Unit 4B
- 9 Holly Rd
- 25 Beverly Ct
- 182 Evergreen Rd Unit 3B
- 182 Evergreen Rd Unit 3A
- 182 Evergreen Rd Unit 1B
- 199 Evergreen Rd Unit 14A
- 199 Evergreen Rd Unit 8A
Your Personal Tour Guide
Ask me questions while you tour the home.