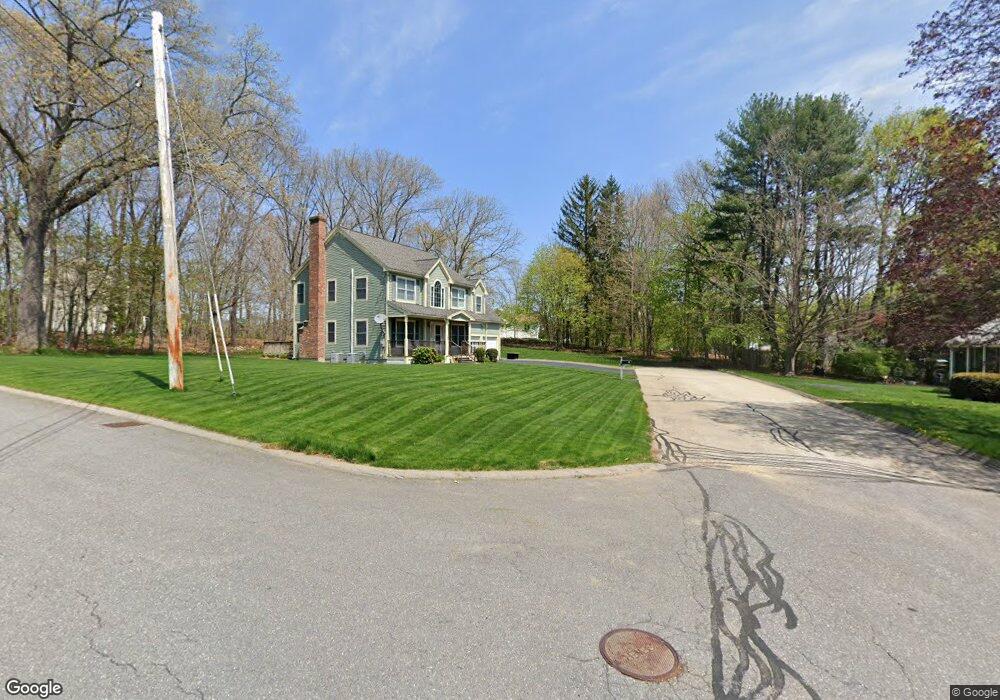
18 Lindberg St Maynard, MA 01754
Estimated Value: $731,880 - $953,000
3
Beds
3
Baths
2,062
Sq Ft
$387/Sq Ft
Est. Value
About This Home
This home is located at 18 Lindberg St, Maynard, MA 01754 and is currently estimated at $798,220, approximately $387 per square foot. 18 Lindberg St is a home located in Middlesex County with nearby schools including Green Meadow School, Fowler School, and Maynard High School.
Ownership History
Date
Name
Owned For
Owner Type
Purchase Details
Closed on
Apr 10, 2019
Sold by
Wiswall Rita L
Bought by
Wiswall William F
Current Estimated Value
Purchase Details
Closed on
Dec 15, 2006
Sold by
Nelson Denise E
Bought by
Wiswell Rita L and Wiswell William F
Home Financials for this Owner
Home Financials are based on the most recent Mortgage that was taken out on this home.
Original Mortgage
$175,000
Interest Rate
6.31%
Mortgage Type
Purchase Money Mortgage
Purchase Details
Closed on
Sep 13, 2002
Sold by
Elder Joseph F and Elder Tracy
Bought by
Arsenault Norman and Arsenault Tina
Purchase Details
Closed on
Mar 30, 2000
Sold by
Mackinnon Janice A
Bought by
Nelson Mark B and Nelson Denise E
Create a Home Valuation Report for This Property
The Home Valuation Report is an in-depth analysis detailing your home's value as well as a comparison with similar homes in the area
Home Values in the Area
Average Home Value in this Area
Purchase History
| Date | Buyer | Sale Price | Title Company |
|---|---|---|---|
| Wiswall William F | $230,000 | -- | |
| Wiswall William F | $230,000 | -- | |
| Wiswell Rita L | $429,900 | -- | |
| Wiswell Rita L | $429,900 | -- | |
| Wiswell Rita L | $429,900 | -- | |
| Arsenault Norman | $50,000 | -- | |
| Arsenault Norman | $50,000 | -- | |
| Nelson Mark B | $125,000 | -- |
Source: Public Records
Mortgage History
| Date | Status | Borrower | Loan Amount |
|---|---|---|---|
| Previous Owner | Wiswell Rita L | $175,000 | |
| Previous Owner | Nelson Mark B | $40,000 |
Source: Public Records
Tax History
| Year | Tax Paid | Tax Assessment Tax Assessment Total Assessment is a certain percentage of the fair market value that is determined by local assessors to be the total taxable value of land and additions on the property. | Land | Improvement |
|---|---|---|---|---|
| 2025 | $10,985 | $616,100 | $300,300 | $315,800 |
| 2024 | $10,478 | $586,000 | $286,200 | $299,800 |
| 2023 | $10,318 | $543,900 | $272,400 | $271,500 |
| 2022 | $9,960 | $485,400 | $229,200 | $256,200 |
| 2021 | $9,567 | $474,800 | $229,200 | $245,600 |
| 2020 | $9,463 | $458,500 | $207,600 | $250,900 |
| 2019 | $9,096 | $432,300 | $198,400 | $233,900 |
| 2018 | $8,916 | $393,800 | $180,600 | $213,200 |
| 2017 | $8,668 | $393,800 | $180,600 | $213,200 |
| 2016 | $8,368 | $393,800 | $180,600 | $213,200 |
| 2015 | $7,974 | $357,400 | $172,500 | $184,900 |
| 2014 | $7,338 | $329,200 | $167,100 | $162,100 |
Source: Public Records
Map
Nearby Homes
- 12 Brown St
- 17 Prospect St
- 37 Glendale St
- 66 Powder Mill Rd
- 68 Powder Mill Rd
- 70 Powder Mill Rd
- 2 & 6 Powder Mill Rd
- 2 Marble Farm Rd
- 63 Conant St
- 30 Acton St
- 2 Wall Ct
- 28 Waltham St Unit A
- 19 Deer Path Unit 5
- 5 Hayes St Unit 5
- 13 Arthur St Unit 15
- 15 Arthur St Unit 15
- 7 Concetta Cir
- 3 Drummer Rd Unit B3
- 6 Durant Ave
- 132 Parker St Unit G5