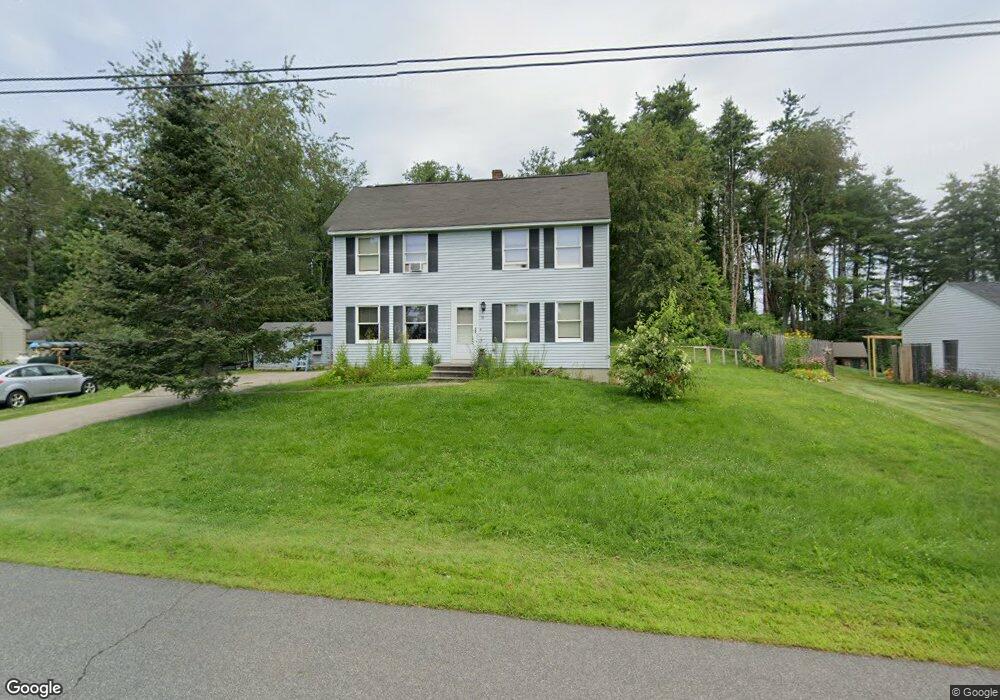
18 Locust Ln South Berwick, ME 03908
Estimated Value: $472,000 - $519,000
4
Beds
2
Baths
1,092
Sq Ft
$449/Sq Ft
Est. Value
About This Home
This home is located at 18 Locust Ln, South Berwick, ME 03908 and is currently estimated at $490,803, approximately $449 per square foot. 18 Locust Ln is a home located in York County with nearby schools including Marshwood High School, Berwick Academy, and Seacoast Christian School.
Ownership History
Date
Name
Owned For
Owner Type
Purchase Details
Closed on
Nov 25, 2023
Sold by
Clark Robert S and Clark Tammie L
Bought by
Clark Robert S and Clark Tammie L
Current Estimated Value
Home Financials for this Owner
Home Financials are based on the most recent Mortgage that was taken out on this home.
Original Mortgage
$365,682
Outstanding Balance
$358,850
Interest Rate
7.63%
Mortgage Type
Purchase Money Mortgage
Estimated Equity
$131,953
Create a Home Valuation Report for This Property
The Home Valuation Report is an in-depth analysis detailing your home's value as well as a comparison with similar homes in the area
Home Values in the Area
Average Home Value in this Area
Purchase History
| Date | Buyer | Sale Price | Title Company |
|---|---|---|---|
| Clark Robert S | -- | None Available |
Source: Public Records
Mortgage History
| Date | Status | Borrower | Loan Amount |
|---|---|---|---|
| Open | Clark Robert S | $365,682 |
Source: Public Records
Tax History Compared to Growth
Tax History
| Year | Tax Paid | Tax Assessment Tax Assessment Total Assessment is a certain percentage of the fair market value that is determined by local assessors to be the total taxable value of land and additions on the property. | Land | Improvement |
|---|---|---|---|---|
| 2024 | $5,116 | $381,200 | $168,600 | $212,600 |
| 2023 | $4,670 | $334,500 | $147,500 | $187,000 |
| 2022 | $4,267 | $293,500 | $140,500 | $153,000 |
| 2021 | $4,367 | $281,000 | $133,900 | $147,100 |
| 2020 | $4,461 | $254,900 | $118,400 | $136,500 |
| 2019 | $4,452 | $236,800 | $107,700 | $129,100 |
| 2018 | $2,095 | $232,600 | $107,400 | $125,200 |
| 2017 | $4,419 | $232,600 | $107,400 | $125,200 |
| 2016 | $4,257 | $232,600 | $107,400 | $125,200 |
| 2015 | $4,140 | $232,600 | $107,400 | $125,200 |
| 2014 | $4,117 | $232,600 | $107,400 | $125,200 |
Source: Public Records
Map
Nearby Homes
- 13 Beaver Dam Rd
- 22 High Knoll Dr
- 5 Knights Pond Rd
- 10 Portland St
- 275 Main St
- 289 Main St
- 24 Spillanes Hill
- 43 Knights Pond Rd
- 72 Vine St
- 26 Stevens Ct
- 95 Oldfields Rd
- 29 Carriage Hill Ln
- 208 Knights Pond Rd
- 0 Lindsay Ln
- 51 Woodland Hills
- 72 Moses Carr Rd
- 400 Gulf Rd
- 3 Bhoireann Ln
- 29 Great Hill Rd
- 4 Bhoireann Ln