Estimated Value: $125,393 - $165,000
2
Beds
1
Bath
672
Sq Ft
$216/Sq Ft
Est. Value
About This Home
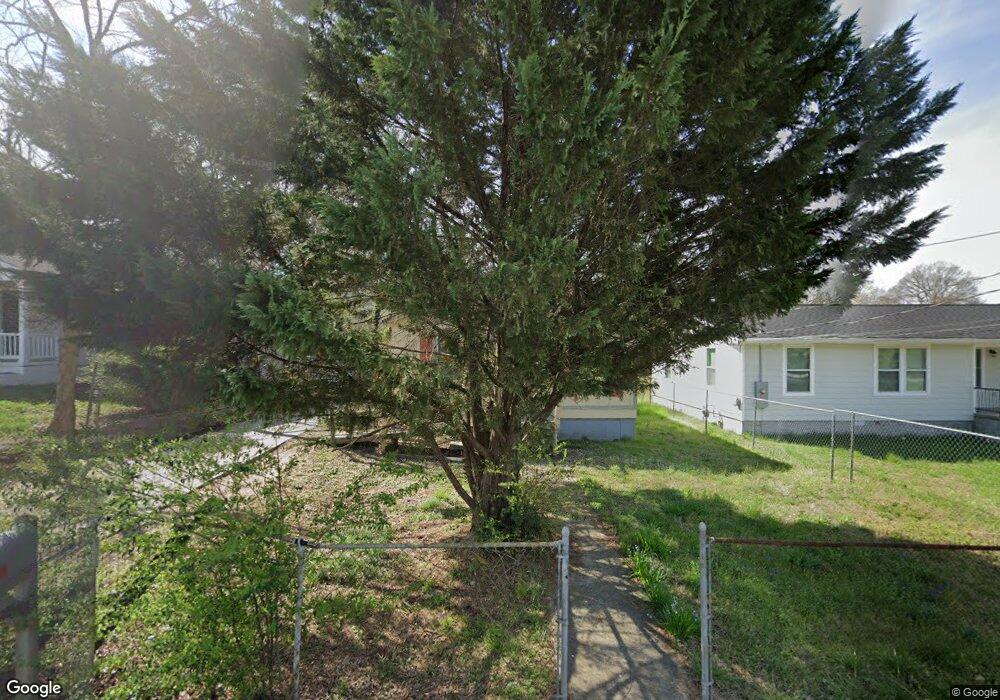
This home is located at 18 Lombardy Way SE, Rome, GA 30161 and is currently estimated at $145,098, approximately $215 per square foot. 18 Lombardy Way SE is a home located in Floyd County with nearby schools including Pepperell Middle School, Pepperell High School, and Montessori School of Rome.
Ownership History
Date
Name
Owned For
Owner Type
Purchase Details
Closed on
Aug 9, 2012
Sold by
Matthews Leroy S
Bought by
Bradley Chindrayani Sitonata
Current Estimated Value
Home Financials for this Owner
Home Financials are based on the most recent Mortgage that was taken out on this home.
Original Mortgage
$22,700
Interest Rate
3.55%
Mortgage Type
New Conventional
Purchase Details
Closed on
Feb 14, 2003
Sold by
Couey James
Bought by
Matthews Leroy S
Purchase Details
Closed on
Oct 29, 1993
Sold by
Massey Jerry Wayne
Bought by
Couey James
Purchase Details
Closed on
Mar 12, 1987
Sold by
Perkins Edward E and Perkins Edw Frances M
Bought by
Massey Jerry Wayne
Purchase Details
Closed on
Aug 6, 1984
Sold by
Gilmore G A Gilmore G A Gilmore G A
Bought by
Perkins Edward E and Perkin Frances M
Purchase Details
Closed on
Jan 1, 1901
Bought by
Gilmore G A Gilmore G A Gilmore G A
Create a Home Valuation Report for This Property
The Home Valuation Report is an in-depth analysis detailing your home's value as well as a comparison with similar homes in the area
Home Values in the Area
Average Home Value in this Area
Purchase History
| Date | Buyer | Sale Price | Title Company |
|---|---|---|---|
| Bradley Chindrayani Sitonata | $24,200 | -- | |
| Matthews Leroy S | $44,000 | -- | |
| Couey James | $30,000 | -- | |
| Massey Jerry Wayne | $23,000 | -- | |
| Perkins Edward E | $17,300 | -- | |
| Gilmore G A Gilmore G A Gilmore G A | -- | -- |
Source: Public Records
Mortgage History
| Date | Status | Borrower | Loan Amount |
|---|---|---|---|
| Closed | Bradley Chindrayani Sitonata | $22,700 |
Source: Public Records
Tax History Compared to Growth
Tax History
| Year | Tax Paid | Tax Assessment Tax Assessment Total Assessment is a certain percentage of the fair market value that is determined by local assessors to be the total taxable value of land and additions on the property. | Land | Improvement |
|---|---|---|---|---|
| 2024 | $1,376 | $39,932 | $2,800 | $37,132 |
| 2023 | $1,086 | $37,870 | $2,400 | $35,470 |
| 2022 | $920 | $31,004 | $2,000 | $29,004 |
| 2021 | $837 | $27,730 | $2,000 | $25,730 |
| 2020 | $743 | $24,410 | $1,600 | $22,810 |
| 2019 | $631 | $21,019 | $1,600 | $19,419 |
| 2018 | $592 | $19,665 | $1,600 | $18,065 |
| 2017 | $568 | $18,835 | $1,600 | $17,235 |
| 2016 | $596 | $19,535 | $1,600 | $17,935 |
| 2015 | $289 | $19,535 | $1,600 | $17,935 |
| 2014 | $289 | $19,535 | $1,600 | $17,935 |
Source: Public Records
Map
Nearby Homes
- 107 E Linden St SE
- 7 Willingham St SW
- 2108 Maple Ave SW
- 2501 Maple Rd SE
- 14 Clover St SW
- 2508 Maple Rd SE
- 111 Hosea St SW
- 2014 Maple Ave SW
- 2107 Rockmart Rd SE
- 0 Martha Berry Hwy Unit 7525627
- 0 Martha Berry Hwy Unit 7614774
- 0 Martha Berry Hwy Unit 10563404
- 2523 Maple Rd SE
- 304 E 19th St SW
- 211 Alfred Ave SE
- 212 Alfred Ave SE
- 1901 Hull Ave SW
- 1705 Olmstead St SW
- 36 Saddle Mountain Rd SE
- 20 Lombardy Way SE
- 20 Lombardy Way SE Unit 27
- 22 Lombardy Way SE
- 16 Lombardy Way SE
- 24 Lombardy Way SE
- 113 E Juniper Way SE
- 115 E Juniper Way SE
- 12 Lombardy Way SE
- 12 Lombardy Way SE
- 111 E Juniper Way SE
- 63 Milco Place SE
- 26 Lombardy Way SE
- 117 E Juniper Way SE
- 77 Milco Place SE
- 73 Milco Place SE
- 109 E Juniper Way SE
- 119 E Juniper Way SE
- 28 Lombardy Way SE
- 10 Lombardy Way SE
- 107 E Juniper Way SE