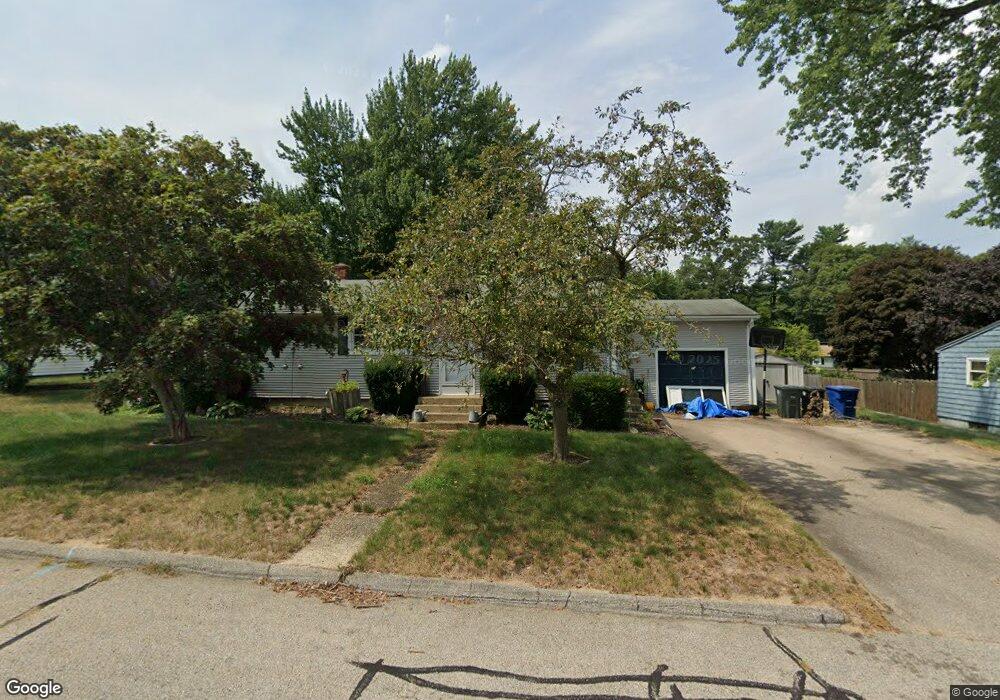
18 Long Pond Rd Coventry, RI 02816
Estimated Value: $346,532 - $391,000
3
Beds
1
Bath
984
Sq Ft
$369/Sq Ft
Est. Value
About This Home
This home is located at 18 Long Pond Rd, Coventry, RI 02816 and is currently estimated at $362,883, approximately $368 per square foot. 18 Long Pond Rd is a home located in Kent County with nearby schools including Alan Shawn Feinstein Ms Of Cov, Coventry High School, and Father John V. Doyle School.
Ownership History
Date
Name
Owned For
Owner Type
Purchase Details
Closed on
Oct 31, 2011
Sold by
Matheny Lori A
Bought by
Matheny Lori A
Current Estimated Value
Home Financials for this Owner
Home Financials are based on the most recent Mortgage that was taken out on this home.
Original Mortgage
$126,000
Outstanding Balance
$86,292
Interest Rate
4.11%
Estimated Equity
$276,591
Purchase Details
Closed on
Jan 7, 1994
Sold by
Belanger James E and Belanger Deborah
Bought by
Noonan Robert J and Parente Lori A
Create a Home Valuation Report for This Property
The Home Valuation Report is an in-depth analysis detailing your home's value as well as a comparison with similar homes in the area
Home Values in the Area
Average Home Value in this Area
Purchase History
| Date | Buyer | Sale Price | Title Company |
|---|---|---|---|
| Matheny Lori A | -- | -- | |
| Noonan Robert J | $105,000 | -- |
Source: Public Records
Mortgage History
| Date | Status | Borrower | Loan Amount |
|---|---|---|---|
| Open | Noonan Robert J | $58,349 | |
| Closed | Noonan Robert J | $20,000 | |
| Open | Noonan Robert J | $126,000 |
Source: Public Records
Tax History Compared to Growth
Tax History
| Year | Tax Paid | Tax Assessment Tax Assessment Total Assessment is a certain percentage of the fair market value that is determined by local assessors to be the total taxable value of land and additions on the property. | Land | Improvement |
|---|---|---|---|---|
| 2024 | $4,028 | $254,300 | $94,600 | $159,700 |
| 2023 | $3,898 | $254,300 | $94,600 | $159,700 |
| 2022 | $3,937 | $201,200 | $93,000 | $108,200 |
| 2021 | $3,903 | $201,200 | $93,000 | $108,200 |
| 2020 | $4,475 | $201,200 | $93,000 | $108,200 |
| 2019 | $3,516 | $158,100 | $64,500 | $93,600 |
| 2018 | $3,417 | $158,100 | $64,500 | $93,600 |
| 2017 | $3,317 | $158,100 | $64,500 | $93,600 |
| 2016 | $3,207 | $149,800 | $68,800 | $81,000 |
| 2015 | $3,120 | $149,800 | $68,800 | $81,000 |
| 2014 | $3,049 | $149,500 | $68,800 | $80,700 |
| 2013 | $3,275 | $175,500 | $72,000 | $103,500 |
Source: Public Records
Map
Nearby Homes