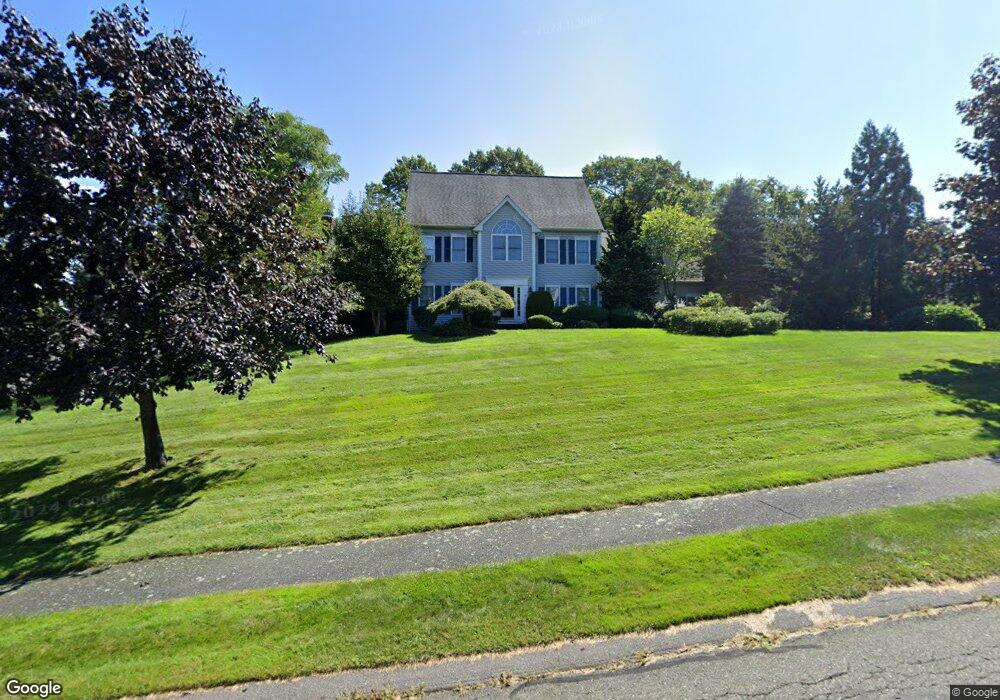
18 Lorraine Dr Ashland, MA 01721
Estimated Value: $1,182,416 - $1,261,000
4
Beds
3
Baths
3,014
Sq Ft
$405/Sq Ft
Est. Value
About This Home
This home is located at 18 Lorraine Dr, Ashland, MA 01721 and is currently estimated at $1,219,604, approximately $404 per square foot. 18 Lorraine Dr is a home located in Middlesex County with nearby schools including William Pittaway Elementary School, David Mindess Elementary School, and Henry E. Warren Elementary School.
Ownership History
Date
Name
Owned For
Owner Type
Purchase Details
Closed on
Jul 30, 2004
Sold by
Raybuck Drew Alan and Raybuck Stacey Lee
Bought by
Sheehan Patricia Busch and Sheehan Terrence
Current Estimated Value
Home Financials for this Owner
Home Financials are based on the most recent Mortgage that was taken out on this home.
Original Mortgage
$350,000
Outstanding Balance
$177,349
Interest Rate
6.33%
Mortgage Type
Purchase Money Mortgage
Estimated Equity
$1,042,255
Purchase Details
Closed on
Aug 23, 1996
Sold by
Richmond Dev Corp
Bought by
Raybuck Drew A and Raybuck Stacey L
Home Financials for this Owner
Home Financials are based on the most recent Mortgage that was taken out on this home.
Original Mortgage
$258,400
Interest Rate
8.4%
Mortgage Type
Purchase Money Mortgage
Create a Home Valuation Report for This Property
The Home Valuation Report is an in-depth analysis detailing your home's value as well as a comparison with similar homes in the area
Home Values in the Area
Average Home Value in this Area
Purchase History
| Date | Buyer | Sale Price | Title Company |
|---|---|---|---|
| Sheehan Patricia Busch | $699,900 | -- | |
| Raybuck Drew A | $323,000 | -- | |
| Richmond Dev Corp | $65,000 | -- |
Source: Public Records
Mortgage History
| Date | Status | Borrower | Loan Amount |
|---|---|---|---|
| Open | Sheehan Patricia Busch | $350,000 | |
| Previous Owner | Richmond Dev Corp | $275,000 | |
| Previous Owner | Richmond Dev Corp | $20,000 | |
| Previous Owner | Richmond Dev Corp | $260,000 | |
| Previous Owner | Richmond Dev Corp | $258,400 |
Source: Public Records
Tax History Compared to Growth
Tax History
| Year | Tax Paid | Tax Assessment Tax Assessment Total Assessment is a certain percentage of the fair market value that is determined by local assessors to be the total taxable value of land and additions on the property. | Land | Improvement |
|---|---|---|---|---|
| 2025 | $13,737 | $1,075,700 | $316,400 | $759,300 |
| 2024 | $13,200 | $997,000 | $316,400 | $680,600 |
| 2023 | $11,819 | $858,300 | $301,400 | $556,900 |
| 2022 | $11,956 | $752,900 | $273,700 | $479,200 |
| 2021 | $11,428 | $717,400 | $273,700 | $443,700 |
| 2020 | $17,578 | $694,300 | $273,700 | $420,600 |
| 2019 | $10,982 | $674,600 | $273,700 | $400,900 |
| 2018 | $10,891 | $648,800 | $269,400 | $379,400 |
| 2017 | $10,561 | $632,400 | $268,200 | $364,200 |
| 2016 | $10,372 | $610,100 | $268,200 | $341,900 |
| 2015 | $10,280 | $594,200 | $256,200 | $338,000 |
| 2014 | $10,058 | $578,400 | $238,200 | $340,200 |
Source: Public Records
Map
Nearby Homes
- 15 Pennock Rd
- 11 Voyagers Ln
- 265 Pleasant St
- 203 Pleasant St
- 20 Braeburn Ln
- 12 Braeburn Ln
- 9 Olive St
- 65 Braeburn Ln Unit 65
- 94 Pleasant St Unit 96
- 28-30 Olive St
- 43 Haven Way
- 37 Park Rd Unit R
- 0 Ballard Highland Marietta Unit 73391306
- 3 Johnson St
- 0 Cross St
- 22-24 Summer St
- 55 Sudbury Rd
- 13 Clark St
- 101 Olive St
- 107 Olive St