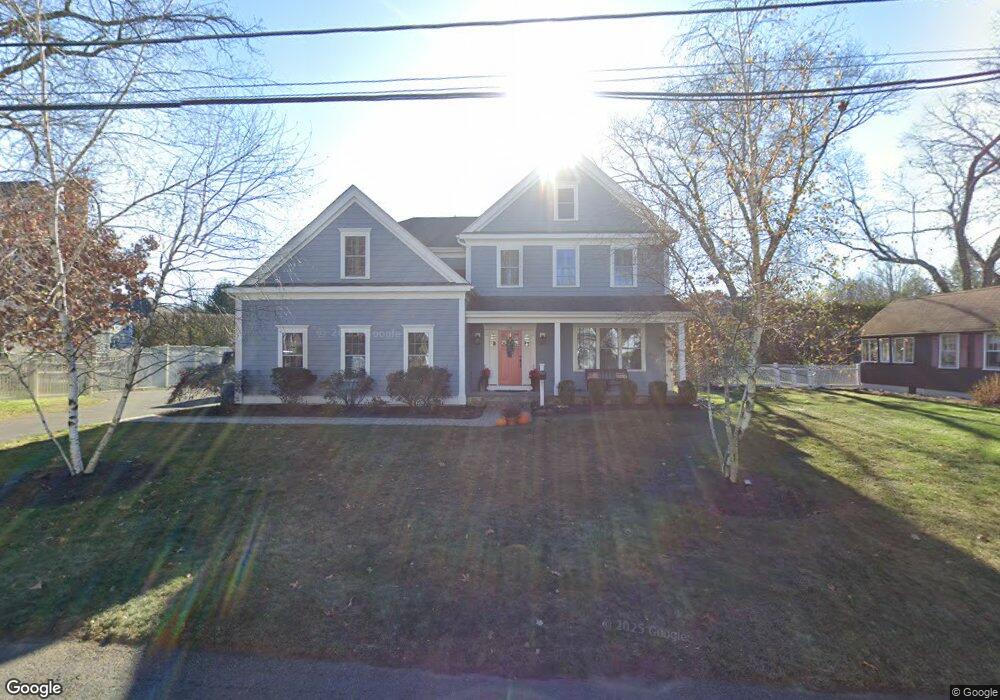
18 Macarthur Rd Wellesley, MA 02482
Estimated Value: $2,518,146 - $3,321,000
5
Beds
5
Baths
3,521
Sq Ft
$826/Sq Ft
Est. Value
About This Home
This home is located at 18 Macarthur Rd, Wellesley, MA 02482 and is currently estimated at $2,908,037, approximately $825 per square foot. 18 Macarthur Rd is a home located in Norfolk County with nearby schools including John D. Hardy Elementary School, Wellesley Middle School, and Wellesley Sr High School.
Ownership History
Date
Name
Owned For
Owner Type
Purchase Details
Closed on
Jan 15, 2013
Sold by
T M Piersiak & Sons Inc
Bought by
Norton Jeanne H
Current Estimated Value
Home Financials for this Owner
Home Financials are based on the most recent Mortgage that was taken out on this home.
Original Mortgage
$1,200,000
Outstanding Balance
$833,973
Interest Rate
3.36%
Mortgage Type
Purchase Money Mortgage
Estimated Equity
$2,074,064
Purchase Details
Closed on
May 15, 2012
Sold by
Chaulk Kenneth C and Chaulk Sarah B
Bought by
Piersiak Thomas M and Piersiak So
Home Financials for this Owner
Home Financials are based on the most recent Mortgage that was taken out on this home.
Original Mortgage
$1,155,000
Interest Rate
4%
Mortgage Type
Purchase Money Mortgage
Create a Home Valuation Report for This Property
The Home Valuation Report is an in-depth analysis detailing your home's value as well as a comparison with similar homes in the area
Purchase History
| Date | Buyer | Sale Price | Title Company |
|---|---|---|---|
| Norton Jeanne H | $1,587,500 | -- | |
| Piersiak Thomas M | $632,000 | -- |
Source: Public Records
Mortgage History
| Date | Status | Borrower | Loan Amount |
|---|---|---|---|
| Open | Norton Jeanne H | $1,200,000 | |
| Previous Owner | Piersiak Thomas M | $1,155,000 | |
| Previous Owner | Norton Jeanne H | $49,700 |
Source: Public Records
Tax History
| Year | Tax Paid | Tax Assessment Tax Assessment Total Assessment is a certain percentage of the fair market value that is determined by local assessors to be the total taxable value of land and additions on the property. | Land | Improvement |
|---|---|---|---|---|
| 2025 | $21,146 | $2,057,000 | $1,042,000 | $1,015,000 |
| 2024 | $20,029 | $1,924,000 | $947,000 | $977,000 |
| 2023 | $19,763 | $1,726,000 | $839,000 | $887,000 |
| 2022 | $19,471 | $1,667,000 | $721,000 | $946,000 |
| 2021 | $19,211 | $1,635,000 | $689,000 | $946,000 |
| 2020 | $18,901 | $1,635,000 | $689,000 | $946,000 |
| 2019 | $18,558 | $1,604,000 | $658,000 | $946,000 |
| 2018 | $19,861 | $1,662,000 | $635,000 | $1,027,000 |
| 2017 | $19,583 | $1,661,000 | $634,000 | $1,027,000 |
| 2016 | $19,247 | $1,627,000 | $624,000 | $1,003,000 |
| 2015 | $18,450 | $1,596,000 | $594,000 | $1,002,000 |
Source: Public Records
Map
Nearby Homes
- 48 Patton Rd
- 40 Pinewood Rd
- 29 Pinewood Rd
- 31 Martin Rd
- 25 Mansfield Rd
- 5 Wilde Rd
- 148 Weston Rd Unit 208
- 23 Pilgrim Rd
- 26B Pleasant St Unit B
- 34 Pleasant St Unit 5
- 31 College Rd
- 63 Oak St Unit B
- 90 Elmwood Rd
- 71 Westgate Rd
- 63 Linden St Unit 1
- 63 Linden St Unit 6
- 16 Oak St
- 4 Shore Rd
- 16 Stearns Rd Unit 101
- 16 Stearns Rd Unit 106
Your Personal Tour Guide
Ask me questions while you tour the home.