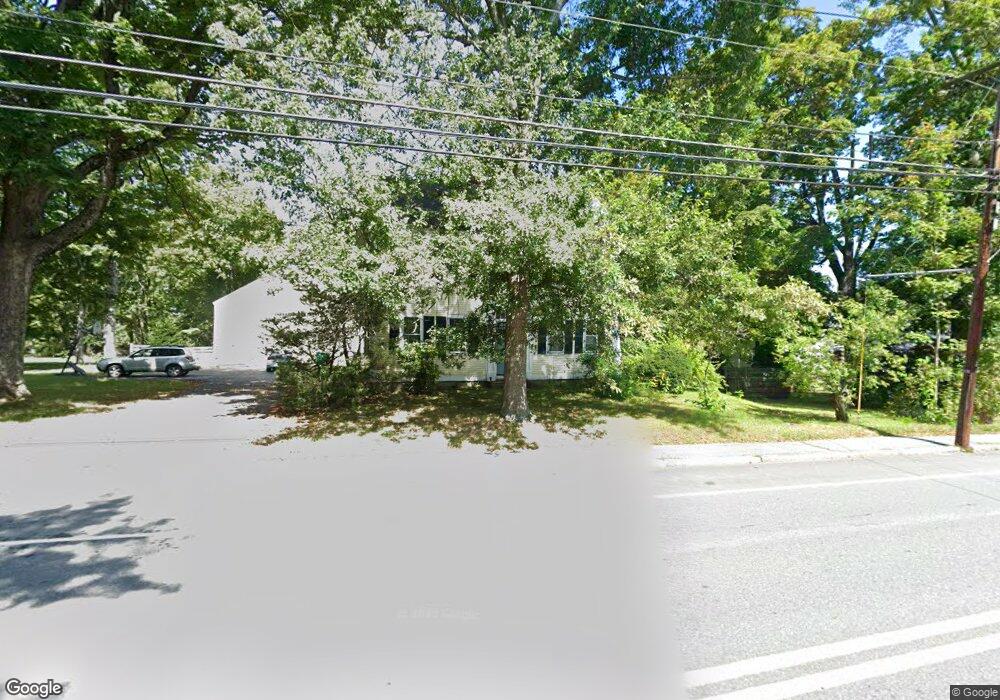
18 Main St Pepperell, MA 01463
Estimated Value: $509,000 - $781,000
4
Beds
2
Baths
3,504
Sq Ft
$194/Sq Ft
Est. Value
About This Home
This home is located at 18 Main St, Pepperell, MA 01463 and is currently estimated at $678,670, approximately $193 per square foot. 18 Main St is a home located in Middlesex County with nearby schools including North Middlesex Regional High School, Pepperell Christian Academy, and Maple Dene & Moppet School.
Ownership History
Date
Name
Owned For
Owner Type
Purchase Details
Closed on
Apr 8, 2025
Sold by
Dufault Peter J and Glenn Janet E
Bought by
P Dufault & J E Glenn Ret and Glenn
Current Estimated Value
Create a Home Valuation Report for This Property
The Home Valuation Report is an in-depth analysis detailing your home's value as well as a comparison with similar homes in the area
Home Values in the Area
Average Home Value in this Area
Purchase History
We collect this data history from publicly available records. To have your information removed, we recommend requesting removal directly through your county’s website.
| Date | Buyer | Sale Price | Title Company |
|---|---|---|---|
| P Dufault & J E Glenn Ret | -- | None Available |
Source: Public Records
Tax History
| Year | Tax Paid | Tax Assessment Tax Assessment Total Assessment is a certain percentage of the fair market value that is determined by local assessors to be the total taxable value of land and additions on the property. | Land | Improvement |
|---|---|---|---|---|
| 2025 | $8,635 | $590,200 | $196,200 | $394,000 |
| 2024 | $8,240 | $574,200 | $180,200 | $394,000 |
| 2023 | $8,077 | $533,500 | $152,200 | $381,300 |
| 2022 | $6,860 | $400,000 | $128,100 | $271,900 |
| 2021 | $6,571 | $366,700 | $112,100 | $254,600 |
| 2020 | $6,911 | $407,000 | $112,100 | $294,900 |
| 2019 | $6,613 | $398,600 | $112,100 | $286,500 |
| 2018 | $5,653 | $344,900 | $112,100 | $232,800 |
| 2017 | $7,029 | $324,500 | $104,100 | $220,400 |
| 2016 | $4,946 | $299,200 | $104,100 | $195,100 |
| 2015 | $4,847 | $303,900 | $104,100 | $199,800 |
| 2014 | $4,707 | $296,800 | $104,100 | $192,700 |
Source: Public Records
Map
Nearby Homes
Your Personal Tour Guide
Ask me questions while you tour the home.