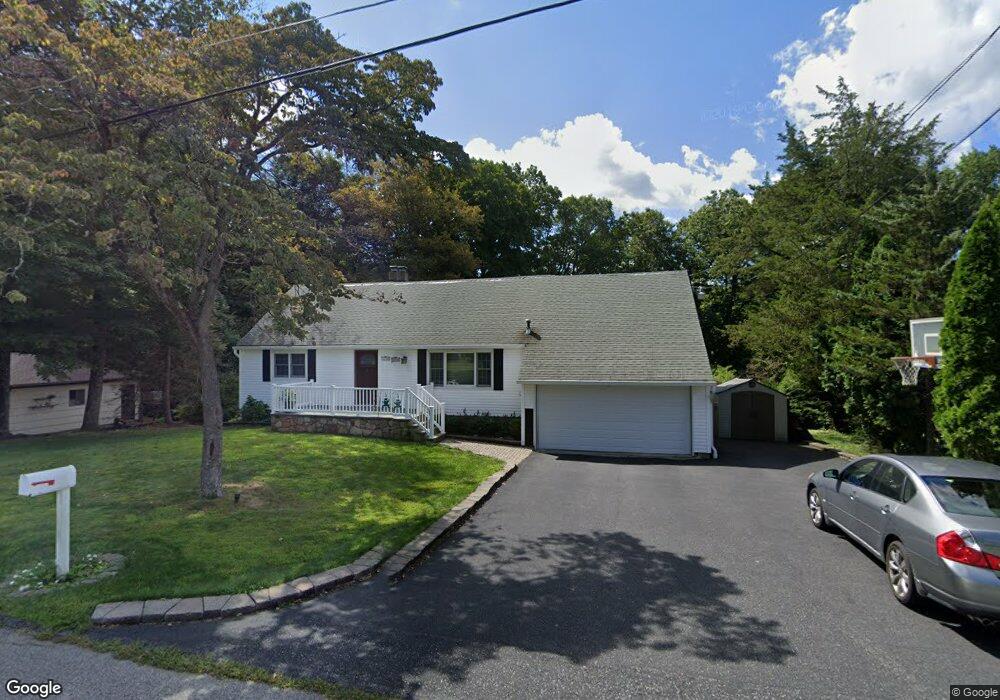
18 Main St Randolph, NJ 07869
Estimated Value: $673,604 - $745,000
Studio
--
Bath
2,107
Sq Ft
$335/Sq Ft
Est. Value
About This Home
This home is located at 18 Main St, Randolph, NJ 07869 and is currently estimated at $705,901, approximately $335 per square foot. 18 Main St is a home located in Morris County with nearby schools including Randolph High School, Randolph Middle School, and American Christian School.
Ownership History
Date
Name
Owned For
Owner Type
Purchase Details
Closed on
Dec 15, 2016
Sold by
Yost George
Bought by
Satimis Ahmet
Current Estimated Value
Purchase Details
Closed on
Mar 26, 1998
Sold by
Dacruz Michael and Dacruz Darlene
Bought by
Jung Brian and Jung Lynda R
Home Financials for this Owner
Home Financials are based on the most recent Mortgage that was taken out on this home.
Original Mortgage
$193,800
Interest Rate
6.98%
Create a Home Valuation Report for This Property
The Home Valuation Report is an in-depth analysis detailing your home's value as well as a comparison with similar homes in the area
Home Values in the Area
Average Home Value in this Area
Purchase History
| Date | Buyer | Sale Price | Title Company |
|---|---|---|---|
| Satimis Ahmet | $145,000 | None Available | |
| Jung Brian | $228,000 | -- |
Source: Public Records
Mortgage History
| Date | Status | Borrower | Loan Amount |
|---|---|---|---|
| Previous Owner | Jung Brian | $193,800 |
Source: Public Records
Tax History
| Year | Tax Paid | Tax Assessment Tax Assessment Total Assessment is a certain percentage of the fair market value that is determined by local assessors to be the total taxable value of land and additions on the property. | Land | Improvement |
|---|---|---|---|---|
| 2025 | $12,578 | $444,300 | $150,200 | $294,100 |
| 2024 | $12,263 | $444,300 | $150,200 | $294,100 |
| 2023 | $12,263 | $444,300 | $150,200 | $294,100 |
| 2022 | $11,783 | $444,300 | $150,200 | $294,100 |
| 2021 | $11,783 | $444,300 | $150,200 | $294,100 |
| 2020 | $11,663 | $444,300 | $150,200 | $294,100 |
| 2019 | $11,530 | $444,300 | $150,200 | $294,100 |
| 2018 | $11,383 | $444,300 | $150,200 | $294,100 |
| 2017 | $11,241 | $444,300 | $150,200 | $294,100 |
| 2016 | $10,127 | $276,700 | $114,700 | $162,000 |
| 2015 | $10,005 | $276,700 | $114,700 | $162,000 |
| 2014 | $9,851 | $276,700 | $114,700 | $162,000 |
Source: Public Records
Map
Nearby Homes
- 25 Budd St
- 7 Sorman Terrace
- 50 Quail Run
- 31 Saint Marys Dr
- 95A Calais Rd
- 4 George St
- 6 Rock Spring Rd
- 29 Cora Ln
- 5 Parkwood Rd
- 234 Dover Chester Rd
- 1430 Sussex Turnpike
- 17 Putters Rd
- 100 Eyland Ave
- 2 Norman Ln
- 29 Joyce Dr
- 6 Pleasant Hill Rd
- 226 Morris Turnpike
- 24 Rivendell Rd
- 29 Eyland Ave
- 309 North Rd
Your Personal Tour Guide
Ask me questions while you tour the home.