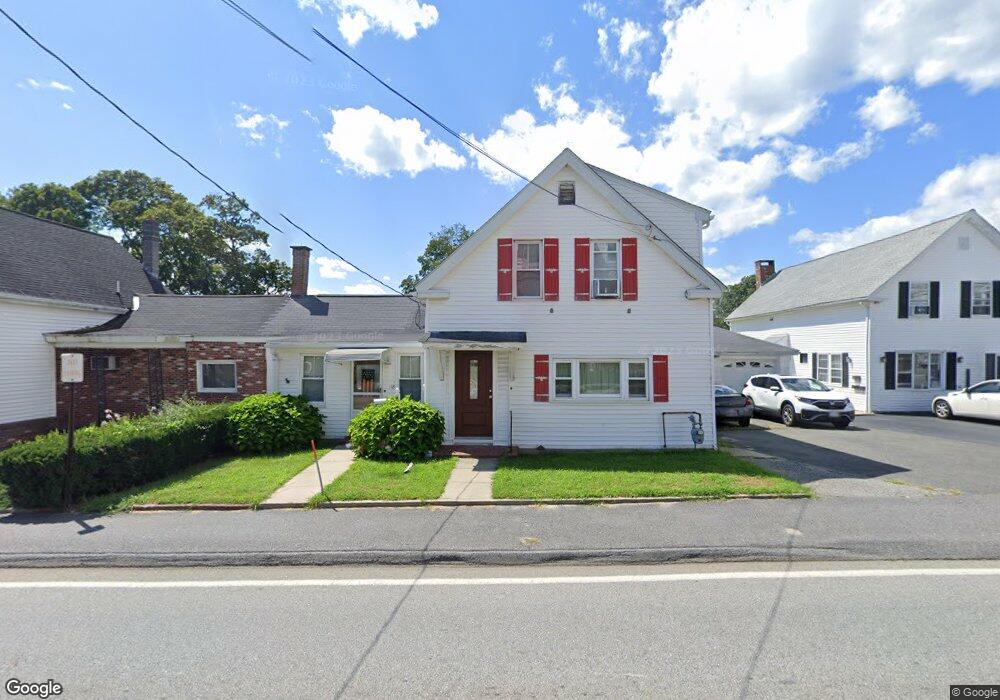
18 Manning St Hudson, MA 01749
Downtown Hudson NeighborhoodEstimated Value: $505,000 - $543,000
3
Beds
1
Bath
1,487
Sq Ft
$348/Sq Ft
Est. Value
About This Home
This home is located at 18 Manning St, Hudson, MA 01749 and is currently estimated at $516,944, approximately $347 per square foot. 18 Manning St is a home located in Middlesex County with nearby schools including David J. Quinn Middle School, Hudson High School, and First Steps Children's Center.
Ownership History
Date
Name
Owned For
Owner Type
Purchase Details
Closed on
Nov 6, 1998
Sold by
Gagne Gerald R and Gagne Natalie
Bought by
Perkins Ann S and Perkins Patricia A
Current Estimated Value
Home Financials for this Owner
Home Financials are based on the most recent Mortgage that was taken out on this home.
Original Mortgage
$126,350
Outstanding Balance
$24,379
Interest Rate
6.64%
Mortgage Type
Purchase Money Mortgage
Estimated Equity
$492,565
Purchase Details
Closed on
Dec 27, 1996
Sold by
Seco Jose M and Seco Olivia C
Bought by
Gagne Gerald R and Gagne Natalie
Home Financials for this Owner
Home Financials are based on the most recent Mortgage that was taken out on this home.
Original Mortgage
$90,000
Interest Rate
7.55%
Mortgage Type
Purchase Money Mortgage
Purchase Details
Closed on
Jun 26, 1991
Sold by
Fernandes Antonio M and Fernandes Izilda S
Bought by
Seco Jose M and Seco Olivia C
Home Financials for this Owner
Home Financials are based on the most recent Mortgage that was taken out on this home.
Original Mortgage
$99,000
Interest Rate
9.44%
Mortgage Type
Purchase Money Mortgage
Create a Home Valuation Report for This Property
The Home Valuation Report is an in-depth analysis detailing your home's value as well as a comparison with similar homes in the area
Home Values in the Area
Average Home Value in this Area
Purchase History
| Date | Buyer | Sale Price | Title Company |
|---|---|---|---|
| Perkins Ann S | $133,000 | -- | |
| Gagne Gerald R | $120,000 | -- | |
| Seco Jose M | $110,000 | -- | |
| Seco Jose M | $110,000 | -- |
Source: Public Records
Mortgage History
| Date | Status | Borrower | Loan Amount |
|---|---|---|---|
| Open | Seco Jose M | $126,350 | |
| Previous Owner | Seco Jose M | $110,000 | |
| Previous Owner | Seco Jose M | $90,000 | |
| Previous Owner | Seco Jose M | $99,000 |
Source: Public Records
Tax History
| Year | Tax Paid | Tax Assessment Tax Assessment Total Assessment is a certain percentage of the fair market value that is determined by local assessors to be the total taxable value of land and additions on the property. | Land | Improvement |
|---|---|---|---|---|
| 2025 | $5,970 | $430,100 | $163,500 | $266,600 |
| 2024 | $5,639 | $402,800 | $148,700 | $254,100 |
| 2023 | $5,469 | $374,600 | $143,000 | $231,600 |
| 2022 | $4,972 | $313,500 | $130,000 | $183,500 |
| 2021 | $4,856 | $292,700 | $123,800 | $168,900 |
| 2020 | $4,540 | $273,300 | $121,300 | $152,000 |
| 2019 | $4,109 | $272,200 | $121,300 | $150,900 |
| 2018 | $4,347 | $248,400 | $115,500 | $132,900 |
| 2017 | $4,036 | $230,600 | $110,100 | $120,500 |
| 2016 | $3,909 | $226,100 | $110,100 | $116,000 |
| 2015 | $3,732 | $216,100 | $110,100 | $106,000 |
| 2014 | $3,536 | $203,000 | $96,500 | $106,500 |
Source: Public Records
Map
Nearby Homes
- 29 Grove St Unit B
- 17 School St Unit A
- 17 School St Unit C
- 17 Mason St
- 107 Apsley St
- 48 Forest Ave
- 56 Park St
- 110 River St
- 200 Manning St Unit 6B
- 3 Lark Dr
- 9 Rebecca Ave
- 4 Autumn Dr Unit B
- 12 Strawberry Ln Unit F
- 0 Washington St
- 1 Glendale Rd
- 60 Marlboro Rd
- 122 Chapin Rd
- 39 Old North Rd
- 17 Wildflower Path Unit 17
- 12 Linden St
- 16 Manning St
- 22 Manning St
- 12 Manning St
- 19 Manning St
- 13 Manning St
- 10 Manning St
- 6 B Manning St Unit 6B
- 30 Manning St
- 30 Manning St Unit 30
- 6 Manning St
- 6 Manning St Unit C
- 34 Manning St
- 32 Manning St
- 32 Manning St Unit 2
- 33 Manning St
- 22 High St
- 154 Main St
- 38 Manning St
- 38 Manning St Unit 1
- 38 Manning St Unit 2
Your Personal Tour Guide
Ask me questions while you tour the home.