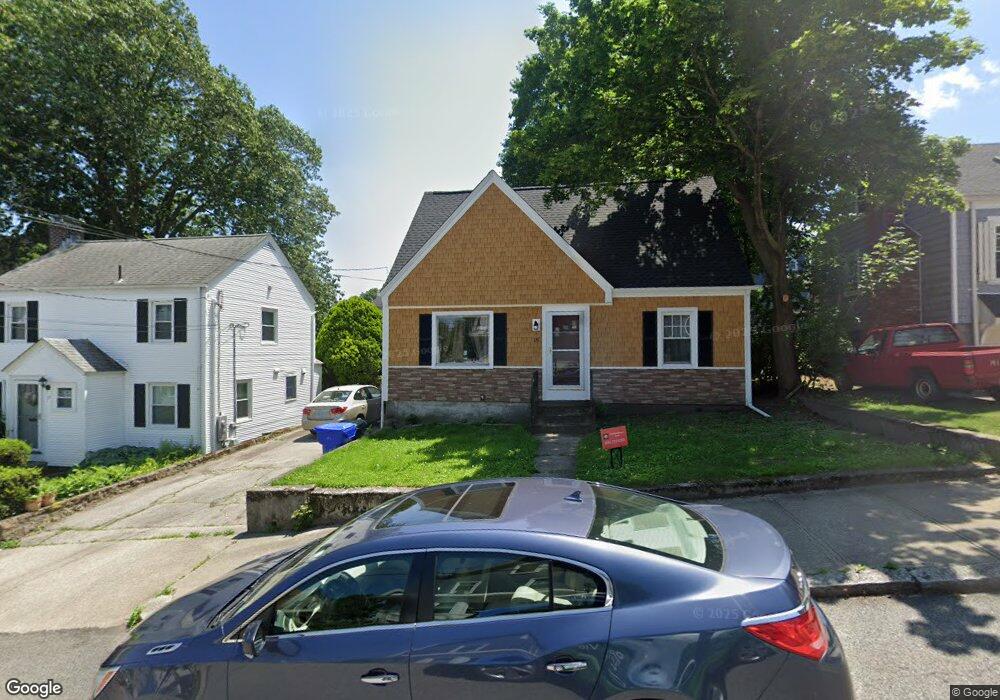
18 Manning St Pawtucket, RI 02860
Oak Hill NeighborhoodEstimated Value: $338,000 - $537,000
4
Beds
2
Baths
2,020
Sq Ft
$209/Sq Ft
Est. Value
About This Home
This home is located at 18 Manning St, Pawtucket, RI 02860 and is currently estimated at $422,911, approximately $209 per square foot. 18 Manning St is a home located in Providence County with nearby schools including International Charter School, Blackstone Academy Charter School, and Ocean Tides School.
Ownership History
Date
Name
Owned For
Owner Type
Purchase Details
Closed on
Apr 16, 2025
Sold by
Pearsall Marla
Bought by
Marla A Pearsall Lt and Pearsall
Current Estimated Value
Purchase Details
Closed on
Sep 22, 1998
Sold by
Messier Kathleen and Devlin Patricia
Bought by
Pearsall Maria
Home Financials for this Owner
Home Financials are based on the most recent Mortgage that was taken out on this home.
Original Mortgage
$74,000
Interest Rate
6.9%
Create a Home Valuation Report for This Property
The Home Valuation Report is an in-depth analysis detailing your home's value as well as a comparison with similar homes in the area
Home Values in the Area
Average Home Value in this Area
Purchase History
| Date | Buyer | Sale Price | Title Company |
|---|---|---|---|
| Marla A Pearsall Lt | -- | None Available | |
| Marla A Pearsall Lt | -- | None Available | |
| Pearsall Maria | $78,000 | -- | |
| Pearsall Maria | $78,000 | -- |
Source: Public Records
Mortgage History
| Date | Status | Borrower | Loan Amount |
|---|---|---|---|
| Previous Owner | Pearsall Maria | $45,000 | |
| Previous Owner | Pearsall Maria | $74,000 |
Source: Public Records
Tax History
| Year | Tax Paid | Tax Assessment Tax Assessment Total Assessment is a certain percentage of the fair market value that is determined by local assessors to be the total taxable value of land and additions on the property. | Land | Improvement |
|---|---|---|---|---|
| 2025 | $3,003 | $228,400 | $80,100 | $148,300 |
| 2024 | $2,818 | $228,400 | $80,100 | $148,300 |
| 2023 | $2,807 | $165,700 | $39,500 | $126,200 |
| 2022 | $2,747 | $165,700 | $39,500 | $126,200 |
| 2021 | $2,747 | $165,700 | $39,500 | $126,200 |
| 2020 | $3,131 | $149,900 | $56,000 | $93,900 |
| 2019 | $3,131 | $149,900 | $56,000 | $93,900 |
| 2018 | $3,017 | $149,900 | $56,000 | $93,900 |
| 2017 | $3,522 | $155,000 | $67,400 | $87,600 |
| 2016 | $3,393 | $155,000 | $67,400 | $87,600 |
| 2015 | $3,393 | $155,000 | $67,400 | $87,600 |
| 2014 | $3,604 | $156,300 | $78,700 | $77,600 |
Source: Public Records
Map
Nearby Homes
- 51 Wilcox Ave
- 18 Dunnell Ave
- 349 Pleasant St
- 345 Pleasant St
- 167 George St
- 126 Dunnell Ave
- 159 Dunnell Ave
- 5 Lowden St
- 11 Sherman St
- 44 Pawtucket Ave
- 122 Lowden St
- 107 Mulberry St
- 187 Sisson St
- 6 Alfred Stone Rd
- 57 Garden St
- 136 Hillside Ave
- 59 West Ave
- 0 Webb St Unit 1406927
- 0 Webb St Unit 73489835
- 45 Harrison St
Your Personal Tour Guide
Ask me questions while you tour the home.