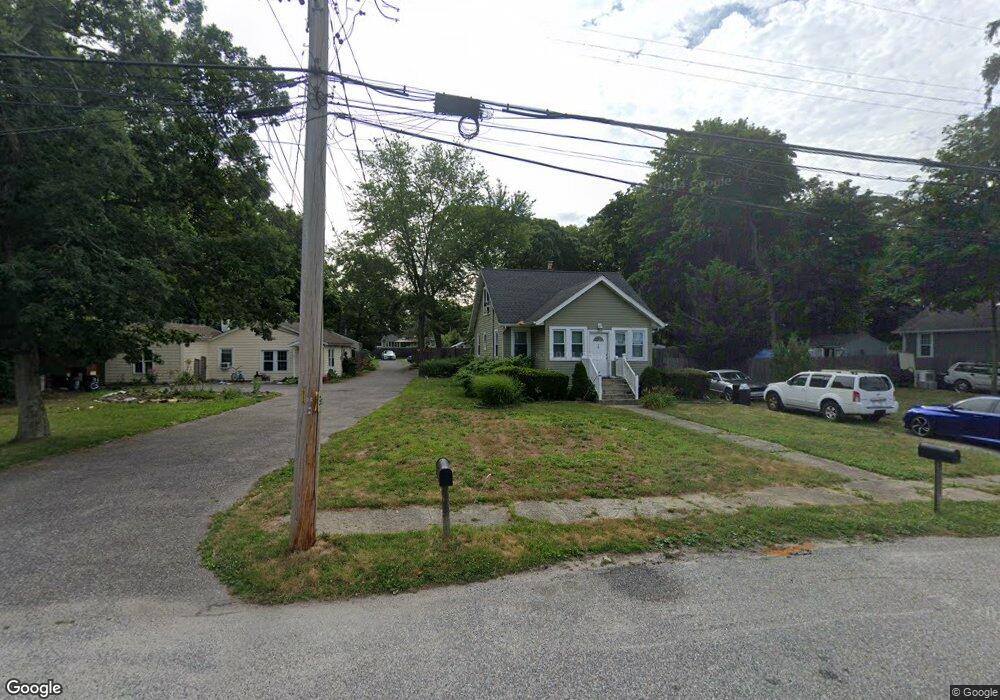
18 Maple Ave Holbrook, NY 11741
Estimated Value: $512,000 - $654,000
3
Beds
1
Bath
1,836
Sq Ft
$331/Sq Ft
Est. Value
About This Home
This home is located at 18 Maple Ave, Holbrook, NY 11741 and is currently estimated at $606,805, approximately $330 per square foot. 18 Maple Ave is a home located in Suffolk County with nearby schools including Hiawatha School, Seneca Middle School, and Sachem High School North.
Ownership History
Date
Name
Owned For
Owner Type
Purchase Details
Closed on
Nov 14, 2005
Sold by
Mallick Jahanara B
Bought by
Uddin Mohammad F
Current Estimated Value
Purchase Details
Closed on
Dec 5, 2002
Sold by
Nabi Noor
Bought by
Mallick Jahanara B
Home Financials for this Owner
Home Financials are based on the most recent Mortgage that was taken out on this home.
Original Mortgage
$257,400
Interest Rate
6.02%
Mortgage Type
Unknown
Purchase Details
Closed on
Aug 28, 2001
Sold by
Perry Robert V and Perry Lynnann
Bought by
Nabi Noor
Home Financials for this Owner
Home Financials are based on the most recent Mortgage that was taken out on this home.
Original Mortgage
$211,470
Interest Rate
7.05%
Purchase Details
Closed on
Feb 9, 1998
Sold by
Geraci Gaetano and Geraci Loretta
Bought by
Perry Robert and Perry Lynnann
Home Financials for this Owner
Home Financials are based on the most recent Mortgage that was taken out on this home.
Original Mortgage
$95,900
Interest Rate
6.98%
Create a Home Valuation Report for This Property
The Home Valuation Report is an in-depth analysis detailing your home's value as well as a comparison with similar homes in the area
Home Values in the Area
Average Home Value in this Area
Purchase History
| Date | Buyer | Sale Price | Title Company |
|---|---|---|---|
| Uddin Mohammad F | $406,850 | Ronald Farr | |
| Mallick Jahanara B | $286,000 | Commonwealth Land Title Ins | |
| Nabi Noor | $222,600 | -- | |
| Perry Robert | $120,000 | Chicago Title Insurance Co |
Source: Public Records
Mortgage History
| Date | Status | Borrower | Loan Amount |
|---|---|---|---|
| Previous Owner | Mallick Jahanara B | $257,400 | |
| Previous Owner | Nabi Noor | $211,470 | |
| Previous Owner | Perry Robert | $95,900 |
Source: Public Records
Tax History Compared to Growth
Tax History
| Year | Tax Paid | Tax Assessment Tax Assessment Total Assessment is a certain percentage of the fair market value that is determined by local assessors to be the total taxable value of land and additions on the property. | Land | Improvement |
|---|---|---|---|---|
| 2024 | $8,392 | $2,544 | $150 | $2,394 |
| 2023 | $8,392 | $2,544 | $150 | $2,394 |
| 2022 | $7,347 | $2,544 | $150 | $2,394 |
| 2021 | $7,347 | $2,544 | $150 | $2,394 |
| 2020 | $7,622 | $2,544 | $150 | $2,394 |
| 2019 | $7,622 | $0 | $0 | $0 |
| 2018 | $7,089 | $2,544 | $150 | $2,394 |
| 2017 | $7,089 | $2,544 | $150 | $2,394 |
| 2016 | $7,079 | $2,544 | $150 | $2,394 |
| 2015 | -- | $2,544 | $150 | $2,394 |
| 2014 | -- | $2,544 | $150 | $2,394 |
Source: Public Records
Map
Nearby Homes