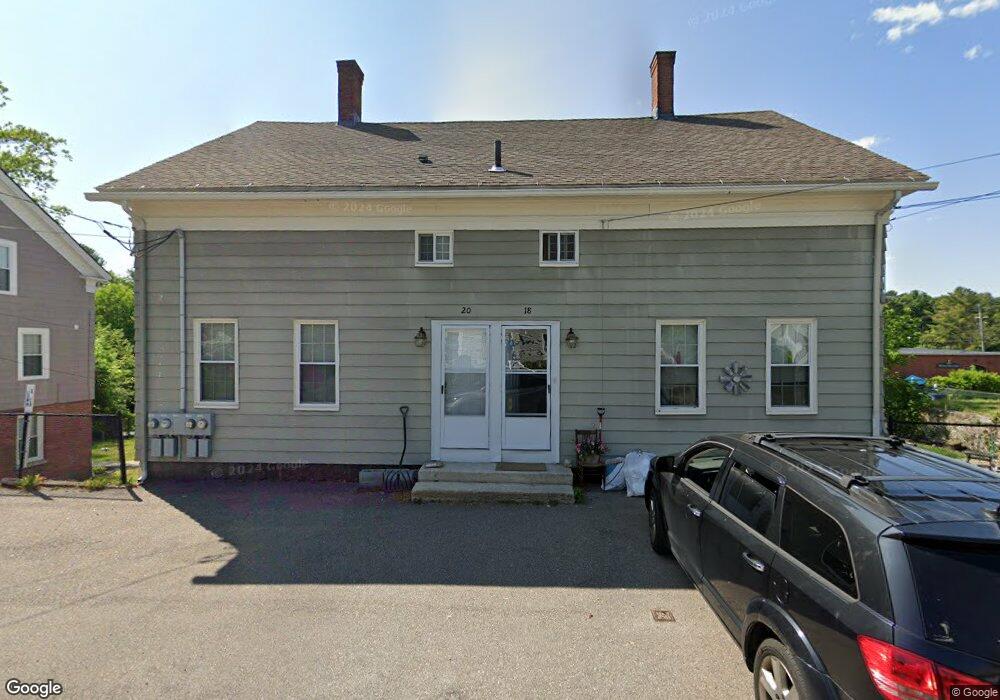
18 Maple Ct Unit 22 Northbridge, MA 01588
Estimated Value: $436,000 - $616,000
3
Beds
1
Bath
900
Sq Ft
$561/Sq Ft
Est. Value
About This Home
This home is located at 18 Maple Ct Unit 22, Northbridge, MA 01588 and is currently estimated at $504,931, approximately $561 per square foot. 18 Maple Ct Unit 22 is a home located in Worcester County with nearby schools including Northbridge Elementary School, Northbridge Middle School, and Northbridge High School.
Ownership History
Date
Name
Owned For
Owner Type
Purchase Details
Closed on
Jan 4, 2022
Sold by
Poisson Arthur R and Poisson April M
Bought by
Golloshi Aleksa
Current Estimated Value
Home Financials for this Owner
Home Financials are based on the most recent Mortgage that was taken out on this home.
Original Mortgage
$408,500
Outstanding Balance
$373,442
Interest Rate
3.12%
Mortgage Type
Purchase Money Mortgage
Estimated Equity
$131,489
Purchase Details
Closed on
Oct 22, 2009
Sold by
Gniadek Joseph S Est and Gniadek
Bought by
Poisson Arthur R
Home Financials for this Owner
Home Financials are based on the most recent Mortgage that was taken out on this home.
Original Mortgage
$160,000
Interest Rate
5.09%
Mortgage Type
Purchase Money Mortgage
Purchase Details
Closed on
Oct 8, 1993
Sold by
Bedrosian Peter and Bedrosian Suzanne
Bought by
Ratcliffe Alan and Ratcliffe Melissa
Create a Home Valuation Report for This Property
The Home Valuation Report is an in-depth analysis detailing your home's value as well as a comparison with similar homes in the area
Home Values in the Area
Average Home Value in this Area
Purchase History
| Date | Buyer | Sale Price | Title Company |
|---|---|---|---|
| Golloshi Aleksa | $430,000 | None Available | |
| Golloshi Aleksa | $430,000 | None Available | |
| Golloshi Aleksa | $430,000 | None Available | |
| Poisson Arthur R | $152,000 | -- | |
| Poisson Arthur R | $152,000 | -- | |
| Poisson Arthur R | $152,000 | -- | |
| Ratcliffe Alan | $118,200 | -- | |
| Ratcliffe Alan | $118,200 | -- |
Source: Public Records
Mortgage History
| Date | Status | Borrower | Loan Amount |
|---|---|---|---|
| Open | Golloshi Aleksa | $408,500 | |
| Closed | Golloshi Aleksa | $408,500 | |
| Previous Owner | Ratcliffe Alan | $137,000 | |
| Previous Owner | Poisson Arthur R | $160,000 |
Source: Public Records
Tax History
| Year | Tax Paid | Tax Assessment Tax Assessment Total Assessment is a certain percentage of the fair market value that is determined by local assessors to be the total taxable value of land and additions on the property. | Land | Improvement |
|---|---|---|---|---|
| 2025 | $5,127 | $434,900 | $120,800 | $314,100 |
| 2024 | $4,727 | $391,000 | $120,800 | $270,200 |
| 2023 | $4,509 | $347,900 | $114,400 | $233,500 |
| 2022 | $3,803 | $276,200 | $88,000 | $188,200 |
| 2021 | $3,476 | $239,900 | $83,900 | $156,000 |
| 2020 | $3,128 | $226,000 | $83,900 | $142,100 |
| 2019 | $2,661 | $205,200 | $83,900 | $121,300 |
| 2018 | $2,604 | $201,200 | $79,900 | $121,300 |
| 2017 | $2,629 | $194,300 | $79,900 | $114,400 |
| 2016 | $2,463 | $179,100 | $68,600 | $110,500 |
| 2015 | $2,396 | $179,100 | $68,600 | $110,500 |
| 2014 | $2,286 | $172,400 | $68,600 | $103,800 |
Source: Public Records
Map
Nearby Homes
- 125 Heritage Dr
- 138 Elm St
- 237 Heritage Dr Unit 237
- 240 Heritage Dr
- 235 Rivulet St
- 0 Homestead Ave
- 12 Hartford Ave E
- 0 Louis St
- 288-290 Providence Rd
- 79 Country Club Dr
- 71 Rivulet St Unit B
- 3 Strathmore Shire Unit A
- 251 Union St
- 7 Jefferson Ct Unit 7
- 128 Linwood Ave
- 208-210 Church St
- 21 Granite St
- 9 Banning Dr
- 831 Providence Rd Unit 837
- 39 Crestwood Cir Unit 42
- 18 Maple Ct
- 28 Maple Ct
- 28-30 Maple Ct
- 21 Maple Ct Unit 21
- 27-29 Maple Ct
- 27 Maple St Unit 27
- 670 Linwood Ave Unit 108
- 670 Linwood Ave Unit 110
- 670 Linwood Ave Unit 225
- 670 Linwood Ave Unit 102
- 670 Linwood Ave Unit 127
- 670 Linwood Ave Unit 119
- 670 Linwood Ave Unit A
- 670 Linwood Ave Unit 219
- 670 Linwood Ave Unit 308
- 670 Linwood Ave Unit 115
- 670 Linwood Ave Unit 202
- 670 Linwood Ave Unit 216
- 670 Linwood Ave Unit 124
- 670 Linwood Ave
Your Personal Tour Guide
Ask me questions while you tour the home.