18 Maple St Viburnum, MO 65566
Estimated Value: $130,000 - $139,000
3
Beds
1
Bath
1,100
Sq Ft
$122/Sq Ft
Est. Value
About This Home
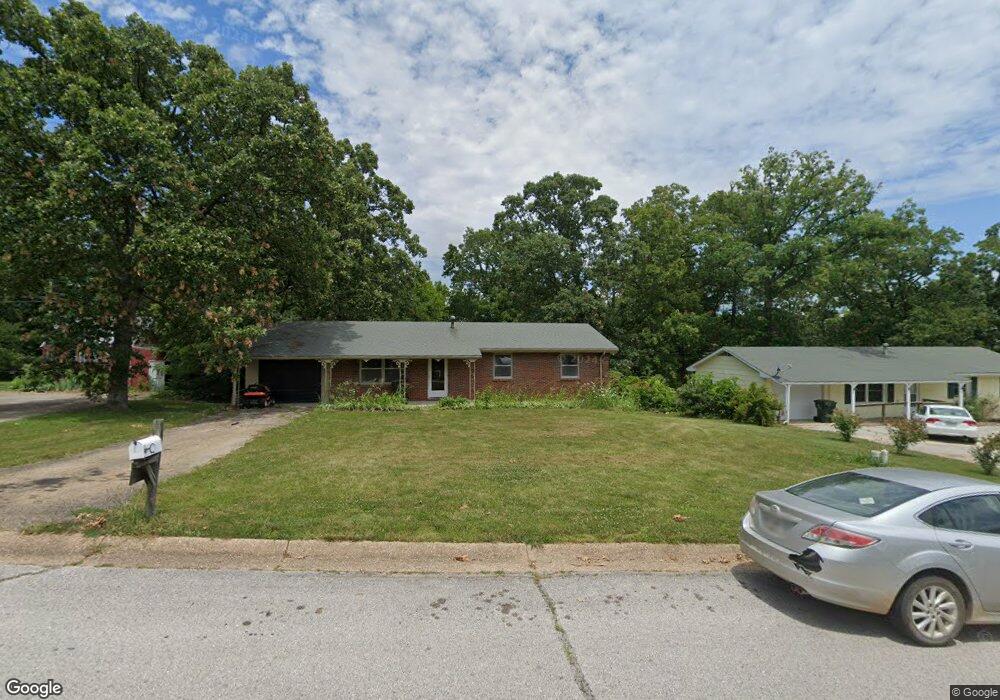
This home is located at 18 Maple St, Viburnum, MO 65566 and is currently estimated at $133,923, approximately $121 per square foot. 18 Maple St is a home with nearby schools including Viburnum Elementary School and Viburnum High School.
Ownership History
Date
Name
Owned For
Owner Type
Purchase Details
Closed on
Mar 26, 1997
Sold by
Boyer Paul E and Boyer Glenda J
Bought by
Thompson Matthew H and La Donna S
Current Estimated Value
Create a Home Valuation Report for This Property
The Home Valuation Report is an in-depth analysis detailing your home's value as well as a comparison with similar homes in the area
Purchase History
| Date | Buyer | Sale Price | Title Company |
|---|---|---|---|
| Thompson Matthew H | $37,000 | -- |
Source: Public Records
Tax History
| Year | Tax Paid | Tax Assessment Tax Assessment Total Assessment is a certain percentage of the fair market value that is determined by local assessors to be the total taxable value of land and additions on the property. | Land | Improvement |
|---|---|---|---|---|
| 2024 | $561 | $11,360 | $940 | $10,420 |
| 2023 | $547 | $11,360 | $940 | $10,420 |
| 2022 | $539 | $11,250 | $830 | $10,420 |
| 2021 | $531 | $11,250 | $830 | $10,420 |
| 2020 | $479 | $9,960 | $830 | $9,130 |
| 2019 | $478 | $9,960 | $830 | $9,130 |
| 2018 | $478 | $9,960 | $830 | $9,130 |
| 2017 | $408 | $9,960 | $830 | $9,130 |
| 2016 | $396 | $10,100 | $830 | $9,270 |
| 2015 | -- | $10,100 | $830 | $9,270 |
| 2014 | -- | $10,510 | $0 | $0 |
| 2011 | -- | $0 | $0 | $0 |
Source: Public Records
Map
Nearby Homes
- 29 Spruce St
- 16 Spruce St
- 11 Saint Joseph St
- 6 Frisco Ln Unit 6
- 5 Frisco Ln
- 000 Ore Haul Rd
- 2 St Joe Trailer Park
- 70 Acres Off Ray Hicks Rd
- 0 Ray Hicks Rd Unit MAR25020733
- 4263 County Road 1
- 210 S Hwy Y
- 33 Civey Blvd
- 2253 State Highway 32
- 36 Arlie Barr Rd
- 000 Hwy C Tract 1
- 0 Highway C Unit MIS26008587
- 00 County Road 4
- 29623 State Highway C
- 362 Bailey Branch Rd
- 539 County Road 69a
Your Personal Tour Guide
Ask me questions while you tour the home.