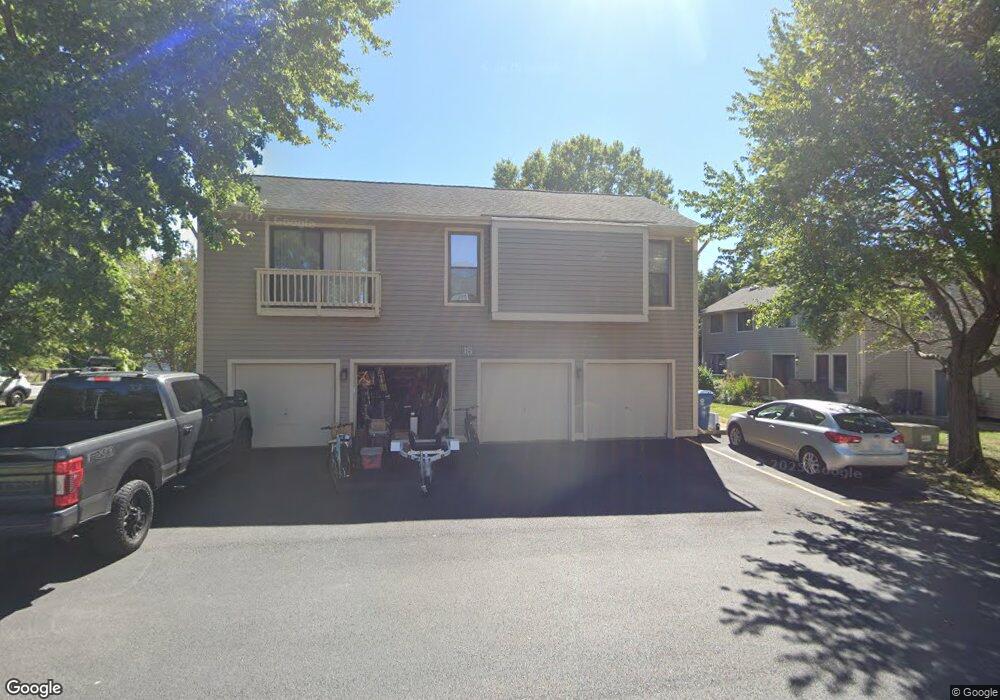
18 Mariners Way Unit D Stevensville, MD 21666
Estimated Value: $250,000 - $264,000
Studio
1
Bath
1,032
Sq Ft
$248/Sq Ft
Est. Value
About This Home
This home is located at 18 Mariners Way Unit D, Stevensville, MD 21666 and is currently estimated at $256,432, approximately $248 per square foot. 18 Mariners Way Unit D is a home located in Queen Anne's County with nearby schools including Kent Island Elementary School, Bayside Elementary School, and Matapeake Middle School.
Ownership History
Date
Name
Owned For
Owner Type
Purchase Details
Closed on
Nov 25, 2025
Sold by
Getty Joseph
Bought by
Nash Junell
Current Estimated Value
Home Financials for this Owner
Home Financials are based on the most recent Mortgage that was taken out on this home.
Original Mortgage
$229,500
Outstanding Balance
$229,500
Interest Rate
6.27%
Mortgage Type
New Conventional
Estimated Equity
$26,932
Purchase Details
Closed on
Oct 14, 2004
Sold by
Hall Steve
Bought by
Getty Joseph
Purchase Details
Closed on
Apr 2, 2003
Sold by
Taylor Wayne C and Taylor Kathryn C
Bought by
Hall Steve
Purchase Details
Closed on
Jul 19, 2000
Sold by
Hubbard Michael W
Bought by
Taylor Wayne C and Taylor Kathryn C
Purchase Details
Closed on
Dec 20, 1994
Sold by
Proctor Veronica M
Bought by
Hubbard Michael W
Create a Home Valuation Report for This Property
The Home Valuation Report is an in-depth analysis detailing your home's value as well as a comparison with similar homes in the area
Home Values in the Area
Average Home Value in this Area
Purchase History
| Date | Buyer | Sale Price | Title Company |
|---|---|---|---|
| Nash Junell | $255,000 | Title Resource Guaranty Compan | |
| Getty Joseph | $138,000 | -- | |
| Hall Steve | $127,500 | -- | |
| Taylor Wayne C | $90,100 | -- | |
| Hubbard Michael W | $76,500 | -- |
Source: Public Records
Mortgage History
| Date | Status | Borrower | Loan Amount |
|---|---|---|---|
| Open | Nash Junell | $229,500 | |
| Closed | Hubbard Michael W | -- |
Source: Public Records
Tax History
| Year | Tax Paid | Tax Assessment Tax Assessment Total Assessment is a certain percentage of the fair market value that is determined by local assessors to be the total taxable value of land and additions on the property. | Land | Improvement |
|---|---|---|---|---|
| 2025 | $1,921 | $203,967 | $0 | $0 |
| 2024 | $1,723 | $182,933 | $0 | $0 |
| 2023 | $1,525 | $161,900 | $80,000 | $81,900 |
| 2022 | $1,495 | $158,733 | $0 | $0 |
| 2021 | $0 | $155,567 | $0 | $0 |
| 2020 | $1,462 | $152,400 | $75,000 | $77,400 |
| 2019 | $1,462 | $152,400 | $75,000 | $77,400 |
| 2018 | $1,462 | $152,400 | $75,000 | $77,400 |
| 2017 | $1,489 | $155,200 | $0 | $0 |
| 2016 | -- | $150,667 | $0 | $0 |
| 2015 | $1,771 | $146,133 | $0 | $0 |
| 2014 | $1,771 | $141,600 | $0 | $0 |
Source: Public Records
Map
Nearby Homes
- 1 UNIT 2 Compass Cir
- 2 Mariners Way Unit 2
- 2 Mariners Way Unit 17-2
- 1004 Marion Quimby Dr
- 1205 Marion Quimby Dr
- 1305 Marion Quimby Dr
- 434 Conor Dr
- 1757 Harbor Dr
- 128 John Patrick Dr
- 131 John Patrick Dr
- 116 Anthony Ln
- 111 Keenan Way
- 108 John Patrick Dr
- 107 Liam Thomas Ln
- 119 Liam Thomas Ln
- 238 Liam Thomas Ln
- 784 Moorings Cir
- 822 Moorings Cir Unit 17
- 252 Mikes Way
- 917 Moorings Cir Unit 131
- 18 Mariners Way Unit A
- 18 Mariners Way
- 18 Mariners Way Unit B1
- 18 Mariners Way Unit A-4
- 18 Mariners Way Unit 1
- 18 Mariners Way Unit 3
- 18A Mariners Way
- 18 Mariners Way Unit A-3
- 18 Mariners Way Unit 3
- 18 Mariners Way Unit A-4
- 18 Mariners Way
- 18B Mariners Way
- 18D Mariners Way
- 17 Mariners Way
- 17 Mariners Way Unit B-1
- 17 Mariners Way Unit 4
- 10 Mariners Way Unit 3
- 10 Mariners Way Unit B
- 10 Mariners Way Unit A
- 10 Mariners Way Unit 3
Your Personal Tour Guide
Ask me questions while you tour the home.