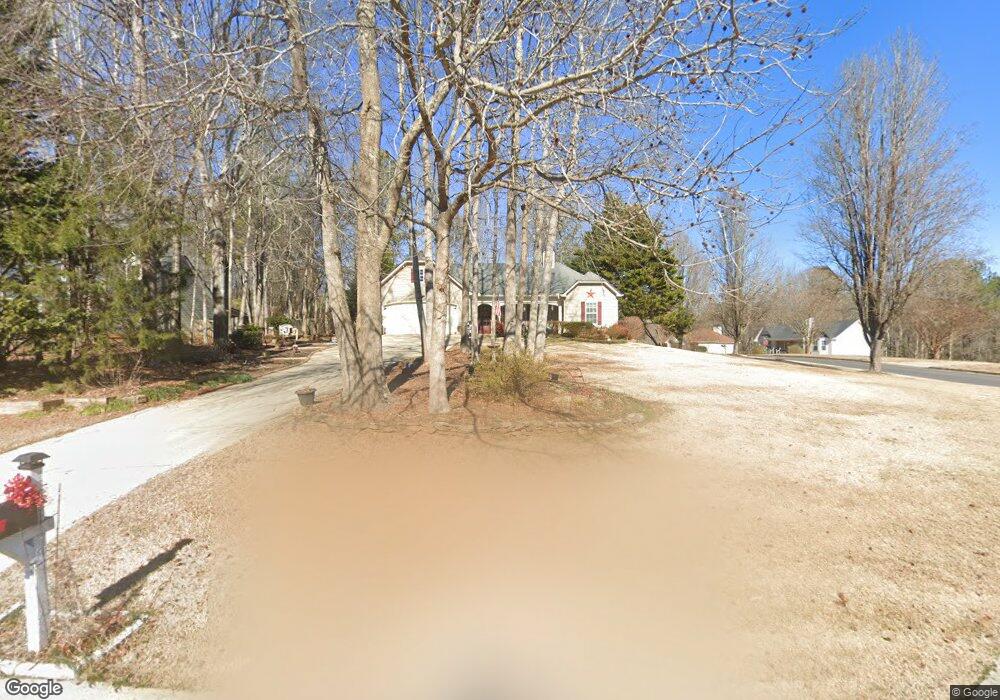
18 Meadow Spring Ct Temple, GA 30179
Estimated Value: $265,434 - $289,000
3
Beds
2
Baths
1,245
Sq Ft
$221/Sq Ft
Est. Value
About This Home
This home is located at 18 Meadow Spring Ct, Temple, GA 30179 and is currently estimated at $275,609, approximately $221 per square foot. 18 Meadow Spring Ct is a home located in Paulding County with nearby schools including Union Elementary School, Carl Scoggins Sr. Middle School, and South Paulding High School.
Ownership History
Date
Name
Owned For
Owner Type
Purchase Details
Closed on
Aug 24, 2004
Sold by
Mulinax Custom Homes
Bought by
Grier Arthur L and Grier Melda
Current Estimated Value
Home Financials for this Owner
Home Financials are based on the most recent Mortgage that was taken out on this home.
Original Mortgage
$96,050
Outstanding Balance
$46,329
Interest Rate
5.91%
Mortgage Type
New Conventional
Estimated Equity
$229,280
Purchase Details
Closed on
Apr 30, 2004
Sold by
J & D Developers
Bought by
Mullinax Custom Homes
Home Financials for this Owner
Home Financials are based on the most recent Mortgage that was taken out on this home.
Original Mortgage
$100,800
Interest Rate
5.36%
Purchase Details
Closed on
Mar 18, 2004
Sold by
Danny Walsh Development Inc
Home Financials for this Owner
Home Financials are based on the most recent Mortgage that was taken out on this home.
Original Mortgage
$100,800
Interest Rate
5.36%
Create a Home Valuation Report for This Property
The Home Valuation Report is an in-depth analysis detailing your home's value as well as a comparison with similar homes in the area
Home Values in the Area
Average Home Value in this Area
Purchase History
| Date | Buyer | Sale Price | Title Company |
|---|---|---|---|
| Grier Arthur L | $120,100 | -- | |
| Mullinax Custom Homes | $26,500 | -- | |
| -- | $26,500 | -- | |
| -- | $27,600 | -- |
Source: Public Records
Mortgage History
| Date | Status | Borrower | Loan Amount |
|---|---|---|---|
| Open | Grier Arthur L | $96,050 | |
| Previous Owner | -- | $100,800 |
Source: Public Records
Tax History
| Year | Tax Paid | Tax Assessment Tax Assessment Total Assessment is a certain percentage of the fair market value that is determined by local assessors to be the total taxable value of land and additions on the property. | Land | Improvement |
|---|---|---|---|---|
| 2025 | $681 | $103,760 | $12,000 | $91,760 |
| 2024 | $682 | $103,320 | $12,000 | $91,320 |
| 2023 | $772 | $98,872 | $12,000 | $86,872 |
| 2022 | $620 | $78,548 | $12,000 | $66,548 |
| 2021 | $599 | $62,064 | $8,000 | $54,064 |
| 2020 | $610 | $59,664 | $8,000 | $51,664 |
| 2019 | $610 | $57,572 | $8,000 | $49,572 |
| 2018 | $517 | $49,940 | $8,000 | $41,940 |
| 2017 | $473 | $44,572 | $8,000 | $36,572 |
| 2016 | $431 | $41,956 | $8,000 | $33,956 |
| 2015 | $344 | $33,012 | $8,000 | $25,012 |
| 2014 | $284 | $26,584 | $8,000 | $18,584 |
| 2013 | -- | $23,160 | $8,000 | $15,160 |
Source: Public Records
Map
Nearby Homes
- 138 W Fork Way
- 191 Meadow Spring Ln
- 200 Bear Ln
- 397 Elk Dr
- 209 Ivey Terrace
- 209 Ivey Terrace Unit 28
- 211 Ivey Terrace
- 211 Ivey Terrace Unit 29
- 213 Ivey Terrace
- 213 Ivey Terrace Unit 30
- 217 Ivey Terrace Unit 32
- 217 Ivey Terrace
- 718 Baskin Rd
- 11070 Buchanan Hwy
- 858 Honeysuckle Ln
- 1968 Allgood Church Rd
- 250 Carter Creek Dr
- 10331 Buchanan Hwy
- 920 Courthouse Rd
- 0 Courthouse Park Dr Unit 10491475
- 38 Meadow Spring Ct
- 336 Meadow Spring Dr
- 387 Meadow Spring Dr
- 15 Meadow Spring Ct
- 351 Meadow Spring Dr
- 35 Meadow Spring Ct
- 64 Meadow Spring Ct
- 369 Meadow Spring Dr
- 51 Meadow Spring Ct
- 86 Meadow Spring Ct
- 182 Meadow Spring Dr
- 333 Meadow Spring Dr
- 65 Meadow Spring Ct
- 106 Meadow Spring Ct
- 85 Meadow Spring Ct
- 298 W Fork Way
- 103 Meadow Spring Ct
- 126 Meadow Spring Ct
- 267 Meadow Spring Dr
- 299 W Fork Way
Your Personal Tour Guide
Ask me questions while you tour the home.