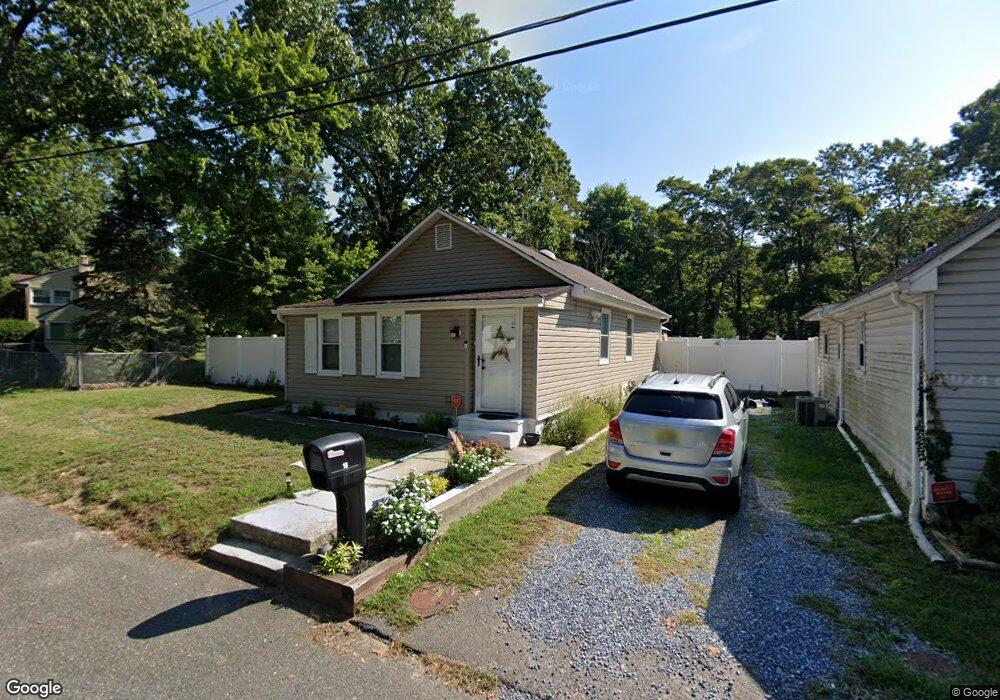
18 Mohawk Ave Clementon, NJ 08021
Estimated Value: $166,119 - $284,000
About This Home
This home is located at 18 Mohawk Ave, Clementon, NJ 08021 and is currently estimated at $213,530, approximately $242 per square foot. 18 Mohawk Ave is a home located in Camden County with nearby schools including John Glenn Elementary School, Pine Hill Middle School, and Overbrook High School.
Ownership History
We collect this data history from publicly available records. To have your information removed, we recommend requesting removal directly through your county’s website.
Purchase Details
Home Financials for this Owner
Home Financials are based on the most recent Mortgage that was taken out on this home.Purchase Details
Home Financials for this Owner
Home Financials are based on the most recent Mortgage that was taken out on this home.Purchase Details
Home Financials for this Owner
Home Financials are based on the most recent Mortgage that was taken out on this home.Home Values in the Area
Average Home Value in this Area
Purchase History
We collect this data history from publicly available records. To have your information removed, we recommend requesting removal directly through your county’s website.
| Date | Buyer | Sale Price | Title Company |
|---|---|---|---|
| $110,000 | None Available | ||
| $119,924 | -- | ||
| $60,000 | -- |
Mortgage History
We collect this data history from publicly available records. To have your information removed, we recommend requesting removal directly through your county’s website.
| Date | Status | Borrower | Loan Amount |
|---|---|---|---|
| Open | $108,007 | ||
| Previous Owner | $116,300 | ||
| Previous Owner | $50,000 |
Tax History
We collect this data history from publicly available records. To have your information removed, we recommend requesting removal directly through your county’s website.
| Year | Tax Paid | Tax Assessment Tax Assessment Total Assessment is a certain percentage of the fair market value that is determined by local assessors to be the total taxable value of land and additions on the property. | Land | Improvement |
|---|---|---|---|---|
| 2025 | $3,486 | $59,600 | $12,000 | $47,600 |
| 2024 | $3,243 | $59,600 | $12,000 | $47,600 |
| 2023 | $3,243 | $59,600 | $12,000 | $47,600 |
| 2022 | $3,150 | $59,600 | $12,000 | $47,600 |
| 2021 | $3,215 | $59,600 | $12,000 | $47,600 |
| 2020 | $3,150 | $59,600 | $12,000 | $47,600 |
| 2019 | $464 | $59,600 | $12,000 | $47,600 |
| 2018 | $3,239 | $59,600 | $12,000 | $47,600 |
| 2017 | $3,170 | $59,600 | $12,000 | $47,600 |
| 2016 | $3,516 | $83,400 | $27,000 | $56,400 |
| 2015 | $3,419 | $83,400 | $27,000 | $56,400 |
| 2014 | $3,321 | $83,400 | $27,000 | $56,400 |
Map
- 32 Clementon Ave
- 36 Mohawk Ave
- 13 Rancocas Ave
- 550 Berlin Rd
- 542 Berlin Rd
- 136 A New Freedom Rd
- 136 New Freedom Rd
- 150 N Smith Terrace
- 142 New Freedom Rd
- 348 White Horse Pike
- 56 Rowand Way E
- 41 Rowand Way E
- 60 Rowand Way E
- 25 Rowand Way E
- 282 Berlin Rd
- 36 Point Breeze Ave
- 5 Higgins Ave
- 2021 S Brighton Ave
- 241 Van Horn Ave
- 62 Higgins Ave
- 20 Mohawk Ave
- 22 Mohawk Ave
- 24 Mohawk Ave
- L13 Mohawk Ave
- 590 Mohawk Ave
- 18 Clementon Ave
- 22 Clementon Ave
- 570 Berlin Rd
- 28 Clementon Ave
- 30 Clementon Ave
- 596 Berlin Rd
- 587 Berlin Rd
- 585 Berlin Rd
- 27 Clementon Ave
- 27 Clementon Ave
- 579 Berlin Rd
- 23 Clementon Ave
- 26 Mohawk Ave
- 29 Clementon Ave
- 19 Clementon Ave
Ask me questions while you tour the home.