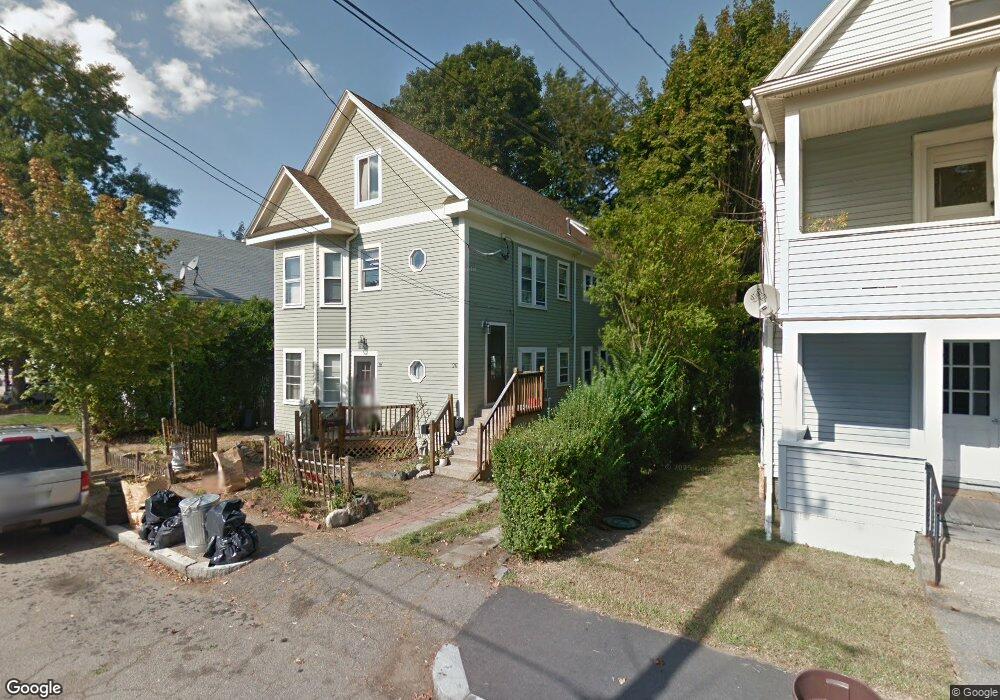
18 Moore St Quincy, MA 02169
Quincy Point NeighborhoodEstimated Value: $721,000 - $939,000
3
Beds
2
Baths
2,678
Sq Ft
$319/Sq Ft
Est. Value
About This Home
This home is located at 18 Moore St, Quincy, MA 02169 and is currently estimated at $854,231, approximately $318 per square foot. 18 Moore St is a home located in Norfolk County with nearby schools including Point Webster Middle School, Clifford H. Marshall Elementary School, and Quincy High School.
Ownership History
Date
Name
Owned For
Owner Type
Purchase Details
Closed on
Sep 23, 2025
Sold by
Buckmann-Maher Rita M
Bought by
Rita M Buckmann-Maher Lt and Buckmann-Maher
Current Estimated Value
Purchase Details
Closed on
Dec 28, 2000
Sold by
Deluca Paul M
Bought by
Buckmann-Maher Rita
Home Financials for this Owner
Home Financials are based on the most recent Mortgage that was taken out on this home.
Original Mortgage
$208,000
Interest Rate
7.7%
Mortgage Type
Purchase Money Mortgage
Create a Home Valuation Report for This Property
The Home Valuation Report is an in-depth analysis detailing your home's value as well as a comparison with similar homes in the area
Home Values in the Area
Average Home Value in this Area
Purchase History
| Date | Buyer | Sale Price | Title Company |
|---|---|---|---|
| Rita M Buckmann-Maher Lt | -- | -- | |
| Buckmann-Maher Rita | $260,000 | -- |
Source: Public Records
Mortgage History
| Date | Status | Borrower | Loan Amount |
|---|---|---|---|
| Previous Owner | Buckmann-Maher Rita | $170,000 | |
| Previous Owner | Buckmann-Maher Rita | $208,000 | |
| Previous Owner | Buckmann-Maher Rita | $208,000 | |
| Previous Owner | Buckmann-Maher Rita | $106,000 |
Source: Public Records
Tax History
| Year | Tax Paid | Tax Assessment Tax Assessment Total Assessment is a certain percentage of the fair market value that is determined by local assessors to be the total taxable value of land and additions on the property. | Land | Improvement |
|---|---|---|---|---|
| 2025 | $8,832 | $766,000 | $271,600 | $494,400 |
| 2024 | $8,316 | $737,900 | $258,700 | $479,200 |
| 2023 | $7,781 | $699,100 | $235,100 | $464,000 |
| 2022 | $7,831 | $653,700 | $213,800 | $439,900 |
| 2021 | $7,953 | $655,100 | $213,800 | $441,300 |
| 2020 | $7,939 | $638,700 | $201,700 | $437,000 |
| 2019 | $7,514 | $598,700 | $186,700 | $412,000 |
| 2018 | $6,966 | $522,200 | $169,700 | $352,500 |
| 2017 | $7,014 | $495,000 | $161,700 | $333,300 |
| 2016 | $6,216 | $432,900 | $147,000 | $285,900 |
| 2015 | $5,986 | $410,000 | $138,600 | $271,400 |
| 2014 | $5,250 | $353,300 | $138,600 | $214,700 |
Source: Public Records
Map
Nearby Homes
- 500 Washington St Unit 201
- 7-9 Kittredge Ave
- 200 Cove Way Unit 304
- 200 Cove Way Unit 614
- 16 Perley Place
- 388 Washington St Unit 301
- 388 Washington St Unit 205
- 388 Washington St Unit 405
- 388 Washington St Unit 202
- 388 Washington St Unit 203
- 388 Washington St Unit 401
- 388 Washington St Unit 302
- 388 Washington St Unit 204
- 388 Washington St Unit 101
- 388 Washington St Unit 304
- 161 Sumner St Unit 2
- 585 Washington St Unit 202
- 585 Washington St Unit model
- 97 Sumner St Unit 1
- 22 James St
- 24 Moore St Unit 1
- 24 Moore St
- 24 Moore St Unit 3
- 24 Moore St Unit 2
- 22/24 Moore St
- 22 Moore St
- 22 Moore St Unit 1
- 14 Moore St
- 14 Moore St Unit 1
- 28 Moore St Unit 28
- 26 Moore St
- 3 Odom St
- 1 Odom St
- 3 Odom St Unit 3
- 32 Silver St
- 32 Silver St Unit 2
- 32 Silver St
- 32 Silver St Unit 1
- 792 Southern Artery Unit 794
- 794 Southern Artery Unit 794
Your Personal Tour Guide
Ask me questions while you tour the home.