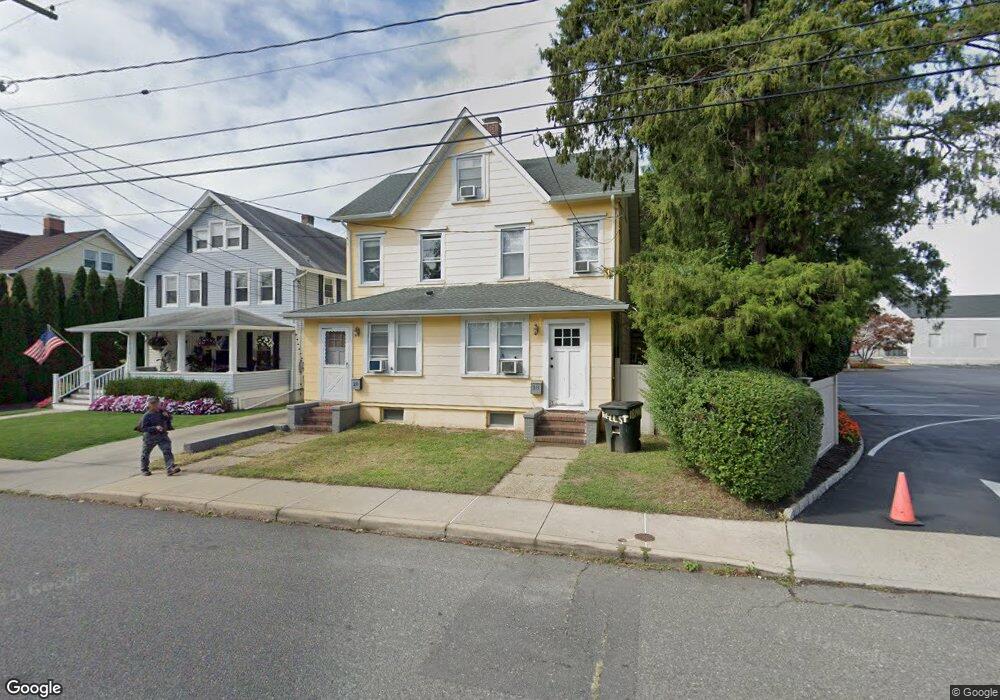
18 Morrell St Unit 20 Long Branch, NJ 07740
Estimated Value: $626,000 - $916,000
4
Beds
3
Baths
2,346
Sq Ft
$336/Sq Ft
Est. Value
About This Home
This home is located at 18 Morrell St Unit 20, Long Branch, NJ 07740 and is currently estimated at $789,283, approximately $336 per square foot. 18 Morrell St Unit 20 is a home located in Monmouth County with nearby schools including Long Branch High School and Holy Trinity School.
Ownership History
Date
Name
Owned For
Owner Type
Purchase Details
Closed on
Oct 30, 2009
Sold by
Fliter Jack A and Fliter Anastasia K
Bought by
Singh Hardev and Kaur Parmjeet
Current Estimated Value
Home Financials for this Owner
Home Financials are based on the most recent Mortgage that was taken out on this home.
Original Mortgage
$125,100
Interest Rate
4.98%
Mortgage Type
Commercial
Create a Home Valuation Report for This Property
The Home Valuation Report is an in-depth analysis detailing your home's value as well as a comparison with similar homes in the area
Home Values in the Area
Average Home Value in this Area
Purchase History
| Date | Buyer | Sale Price | Title Company |
|---|---|---|---|
| Singh Hardev | $265,000 | None Available |
Source: Public Records
Mortgage History
| Date | Status | Borrower | Loan Amount |
|---|---|---|---|
| Closed | Singh Hardev | $125,100 |
Source: Public Records
Tax History
| Year | Tax Paid | Tax Assessment Tax Assessment Total Assessment is a certain percentage of the fair market value that is determined by local assessors to be the total taxable value of land and additions on the property. | Land | Improvement |
|---|---|---|---|---|
| 2025 | $9,588 | $691,400 | $258,500 | $432,900 |
| 2024 | $8,632 | $623,800 | $228,500 | $395,300 |
| 2023 | $8,632 | $555,800 | $178,500 | $377,300 |
| 2022 | $7,662 | $452,800 | $120,400 | $332,400 |
| 2021 | $7,529 | $382,900 | $100,400 | $282,500 |
| 2020 | $7,737 | $370,200 | $89,400 | $280,800 |
| 2019 | $7,529 | $358,200 | $90,400 | $267,800 |
| 2018 | $7,365 | $348,400 | $90,400 | $258,000 |
| 2017 | $7,080 | $343,500 | $90,400 | $253,100 |
| 2016 | $6,912 | $342,000 | $95,400 | $246,600 |
| 2015 | $6,004 | $269,600 | $101,500 | $168,100 |
| 2014 | $5,557 | $263,000 | $113,800 | $149,200 |
Source: Public Records
Map
Nearby Homes
- 28 Morrell St
- 75 Washington St
- 88 Norwood Ave
- 539 Summer St
- 395 Broadway
- 25 Howland Place
- 25 Community Place
- 554 Winter St
- 681 Morford Ave
- 288 Morris Ave
- 657 Campbell Ave
- 274 Bath Ave
- 274 Bath Ave Unit 23
- 274 N Bath Ave Unit 8
- 638 Overton Place
- 631 Irving Place
- 364 Westwood Ave Unit 52
- 364 Westwood Ave Unit 21
- 303 Westwood Ave
- 377 Westwood Ave
Your Personal Tour Guide
Ask me questions while you tour the home.