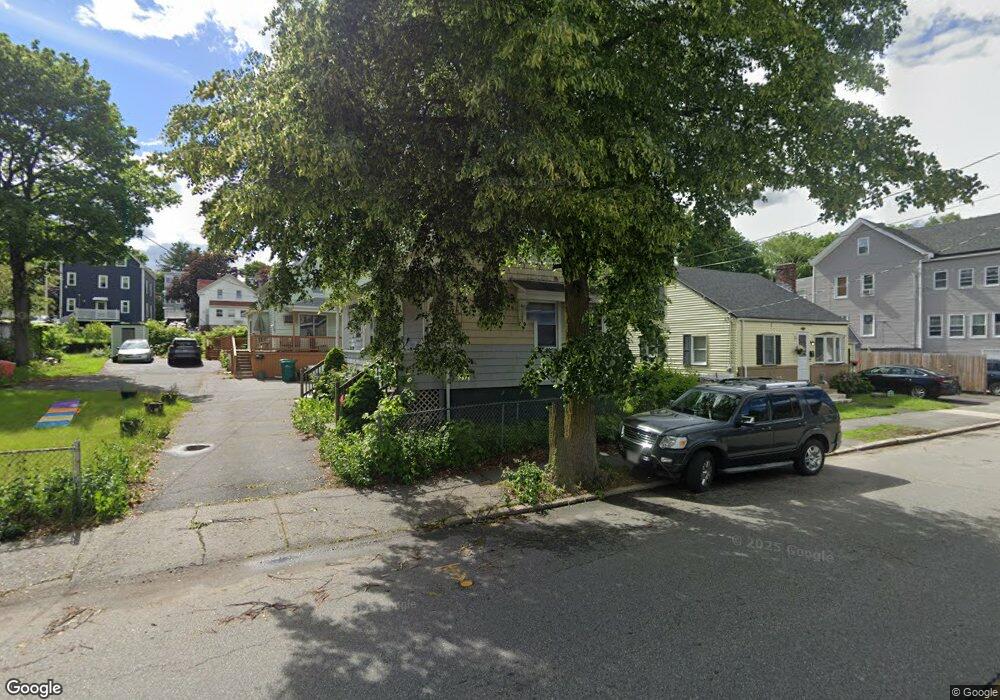
18 Myrtle St Lynn, MA 01905
Lower Boston Street NeighborhoodEstimated Value: $376,000 - $463,000
2
Beds
1
Bath
865
Sq Ft
$499/Sq Ft
Est. Value
About This Home
This home is located at 18 Myrtle St, Lynn, MA 01905 and is currently estimated at $431,413, approximately $498 per square foot. 18 Myrtle St is a home located in Essex County with nearby schools including Lincoln-Thomson Elementary School, William R. Fallon School, and Breed Middle School.
Ownership History
Date
Name
Owned For
Owner Type
Purchase Details
Closed on
Mar 31, 2005
Sold by
Devine Kelly P
Bought by
Gagliardi Carmen E
Current Estimated Value
Home Financials for this Owner
Home Financials are based on the most recent Mortgage that was taken out on this home.
Original Mortgage
$156,000
Outstanding Balance
$79,612
Interest Rate
5.61%
Mortgage Type
Purchase Money Mortgage
Estimated Equity
$351,801
Purchase Details
Closed on
Oct 5, 2001
Sold by
Plourde Irene C
Bought by
Devine Kelly P
Create a Home Valuation Report for This Property
The Home Valuation Report is an in-depth analysis detailing your home's value as well as a comparison with similar homes in the area
Home Values in the Area
Average Home Value in this Area
Purchase History
| Date | Buyer | Sale Price | Title Company |
|---|---|---|---|
| Gagliardi Carmen E | $195,000 | -- | |
| Devine Kelly P | $135,000 | -- |
Source: Public Records
Mortgage History
| Date | Status | Borrower | Loan Amount |
|---|---|---|---|
| Open | Gagliardi Carmen E | $156,000 |
Source: Public Records
Tax History
| Year | Tax Paid | Tax Assessment Tax Assessment Total Assessment is a certain percentage of the fair market value that is determined by local assessors to be the total taxable value of land and additions on the property. | Land | Improvement |
|---|---|---|---|---|
| 2025 | $4,483 | $432,700 | $220,200 | $212,500 |
| 2024 | $4,146 | $393,700 | $193,400 | $200,300 |
| 2023 | $4,176 | $374,500 | $199,800 | $174,700 |
| 2022 | $3,779 | $304,000 | $148,000 | $156,000 |
| 2021 | $3,663 | $281,100 | $136,000 | $145,100 |
| 2020 | $3,539 | $264,100 | $130,900 | $133,200 |
| 2019 | $3,552 | $248,400 | $123,300 | $125,100 |
| 2018 | $3,630 | $239,600 | $136,000 | $103,600 |
| 2017 | $3,285 | $210,600 | $113,100 | $97,500 |
| 2016 | $3,199 | $197,700 | $105,900 | $91,800 |
| 2015 | $3,092 | $184,600 | $105,000 | $79,600 |
Source: Public Records
Map
Nearby Homes
- 590 Boston St Unit 303
- 46 Wilfred St
- 70 Wyman St
- 79 Laurel St
- 73 Waterhill St
- 78-80 Spencer St
- 20 Murray St
- 45 Cottage St Unit 3
- 50-50A Kirtland St
- 268 Walnut St
- 11 Margin St Unit 7
- 6 Morris St
- 76-78 Linden St
- 32 Birch Brook Landing Unit 23
- 32 Birch Brook Landing Unit 25
- 32 Birch Brook Landing Unit 22
- 189 Holyoke St
- 32 Birch Brook Rd Unit 13
- 32 Birch Brook Rd Unit 27
- 32 Birch Brook Rd Unit 16
Your Personal Tour Guide
Ask me questions while you tour the home.