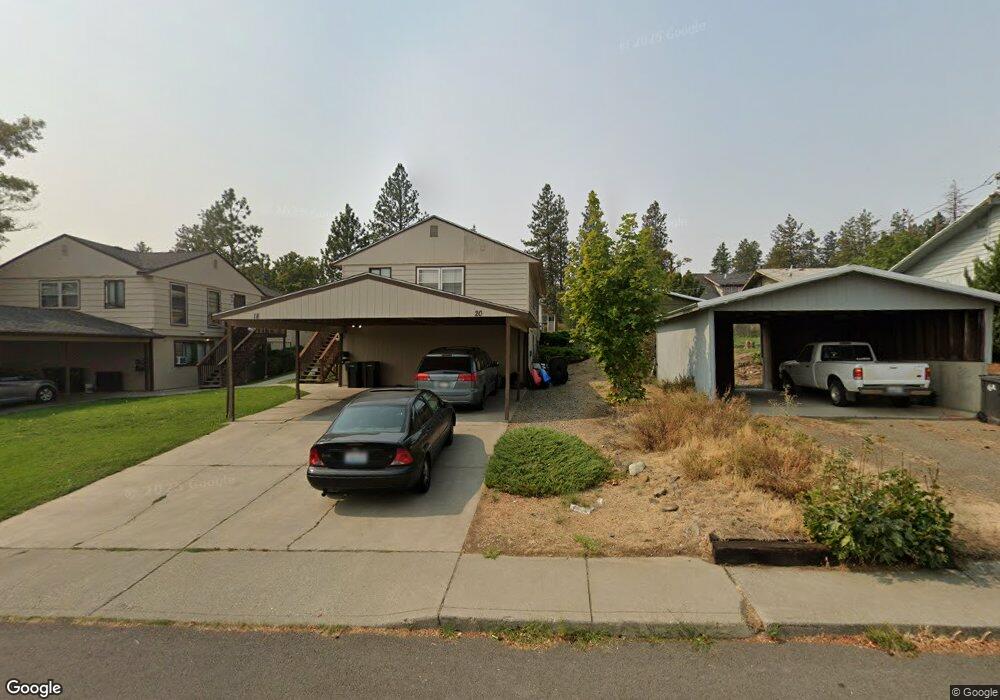
18 N 2nd St Cheney, WA 99004
Estimated Value: $314,000 - $339,000
4
Beds
2
Baths
1,971
Sq Ft
$166/Sq Ft
Est. Value
About This Home
This home is located at 18 N 2nd St, Cheney, WA 99004 and is currently estimated at $328,000, approximately $166 per square foot. 18 N 2nd St is a home located in Spokane County with nearby schools including Betz Elementary School, Cheney Middle School, and Cheney High School.
Ownership History
Date
Name
Owned For
Owner Type
Purchase Details
Closed on
Sep 30, 2021
Sold by
Catlow Properties Llc
Bought by
Jzk Real Estate Llc
Current Estimated Value
Home Financials for this Owner
Home Financials are based on the most recent Mortgage that was taken out on this home.
Original Mortgage
$700,000
Outstanding Balance
$638,335
Interest Rate
2.8%
Mortgage Type
Credit Line Revolving
Estimated Equity
-$310,335
Purchase Details
Closed on
Dec 3, 2001
Sold by
Catlow Craig L and Catlow Sharon K
Bought by
Catlow Properties Llc
Purchase Details
Closed on
Nov 19, 2001
Sold by
Catlow Properties Llc
Bought by
Catlow Craig L and Catlow Sharon K
Create a Home Valuation Report for This Property
The Home Valuation Report is an in-depth analysis detailing your home's value as well as a comparison with similar homes in the area
Purchase History
We collect this data history from publicly available records. To have your information removed, we recommend requesting removal directly through your county’s website.
| Date | Buyer | Sale Price | Title Company |
|---|---|---|---|
| Jzk Real Estate Llc | $875,000 | Spokane County Title | |
| Catlow Properties Llc | -- | First American Title Ins | |
| Catlow Craig L | -- | First American Title Ins |
Source: Public Records
Mortgage History
We collect this data history from publicly available records. To have your information removed, we recommend requesting removal directly through your county’s website.
| Date | Status | Borrower | Loan Amount |
|---|---|---|---|
| Open | Jzk Real Estate Llc | $700,000 |
Source: Public Records
Tax History
| Year | Tax Paid | Tax Assessment Tax Assessment Total Assessment is a certain percentage of the fair market value that is determined by local assessors to be the total taxable value of land and additions on the property. | Land | Improvement |
|---|---|---|---|---|
| 2025 | $3,016 | $278,300 | $70,000 | $208,300 |
| 2024 | $3,016 | $273,400 | $75,000 | $198,400 |
| 2023 | $2,163 | $242,200 | $75,000 | $167,200 |
| 2022 | $2,078 | $257,800 | $75,000 | $182,800 |
| 2021 | $1,944 | $169,700 | $31,500 | $138,200 |
| 2020 | $1,890 | $154,600 | $30,000 | $124,600 |
| 2019 | $1,627 | $140,000 | $28,000 | $112,000 |
| 2018 | $1,792 | $134,300 | $28,000 | $106,300 |
| 2017 | $1,552 | $128,500 | $28,000 | $100,500 |
| 2016 | $1,536 | $122,500 | $28,000 | $94,500 |
| 2015 | $1,483 | $120,300 | $28,000 | $92,300 |
| 2014 | -- | $120,300 | $28,000 | $92,300 |
| 2013 | -- | $0 | $0 | $0 |
Source: Public Records
Map
Nearby Homes
- 3 N 3rd St
- 1239 1st St
- 916 2nd St Unit 918
- 1521 4th St
- 706 2nd St
- 5339 W Anderson Rd
- 1626 5th St
- 1717 2nd St
- 317 College Ave
- 422 4th St
- 1820 5th St
- 217 Nolan Brown Place
- 11819 Washington 904
- 323 5th St
- 2319 Annie Place
- 318 Plum Tree Ct Unit Lot 10 Block 3 - Sno
- 500 N 9th St
- 506 N 9th St
- 314 Plum Tree Ct Unit Lot 20 Block 3 - Sno
- 2331 Annie Place Unit Lot 12 Block 3 - Sno
Your Personal Tour Guide
Ask me questions while you tour the home.