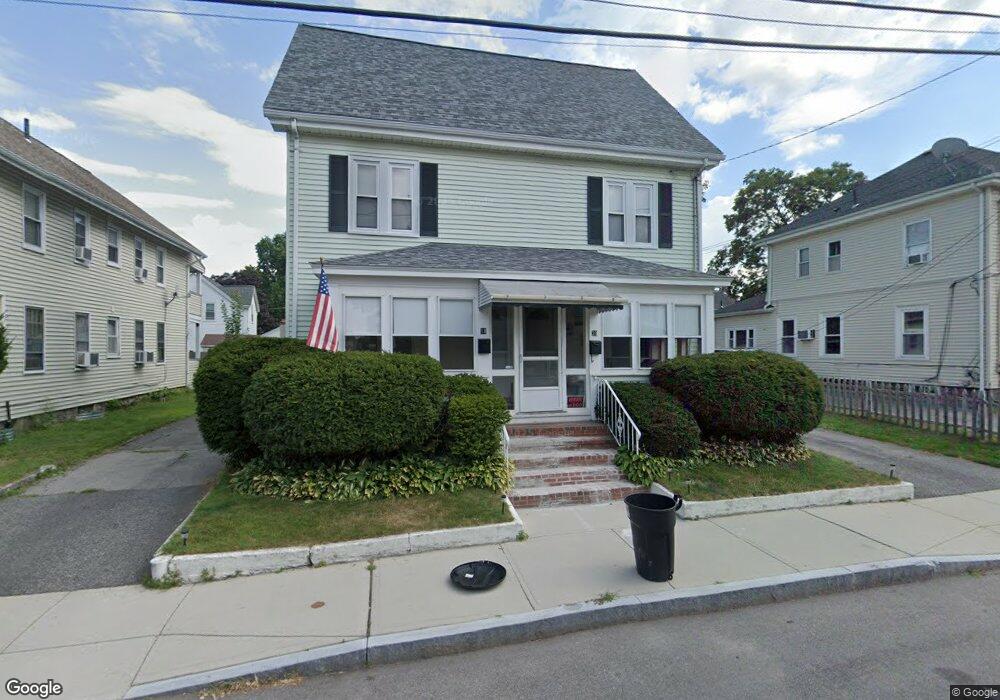
18 N Payne St Quincy, MA 02169
South Quincy NeighborhoodEstimated Value: $766,000 - $930,000
4
Beds
2
Baths
2,040
Sq Ft
$425/Sq Ft
Est. Value
About This Home
This home is located at 18 N Payne St, Quincy, MA 02169 and is currently estimated at $866,863, approximately $424 per square foot. 18 N Payne St is a home located in Norfolk County with nearby schools including Lincoln-Hancock Community School, South West Middle School, and Quincy High School.
Ownership History
Date
Name
Owned For
Owner Type
Purchase Details
Closed on
May 7, 2018
Sold by
Burke Marilyn
Bought by
18-20 Payne Street Rt
Current Estimated Value
Purchase Details
Closed on
Aug 31, 2000
Sold by
Burke Richard A
Bought by
Burke Marilyn
Home Financials for this Owner
Home Financials are based on the most recent Mortgage that was taken out on this home.
Original Mortgage
$204,000
Interest Rate
8.16%
Mortgage Type
Purchase Money Mortgage
Create a Home Valuation Report for This Property
The Home Valuation Report is an in-depth analysis detailing your home's value as well as a comparison with similar homes in the area
Home Values in the Area
Average Home Value in this Area
Purchase History
| Date | Buyer | Sale Price | Title Company |
|---|---|---|---|
| 18-20 Payne Street Rt | -- | -- | |
| Burke Marilyn | $255,000 | -- |
Source: Public Records
Mortgage History
| Date | Status | Borrower | Loan Amount |
|---|---|---|---|
| Previous Owner | Burke Marilyn | $26,000 | |
| Previous Owner | Burke Marilyn | $203,000 | |
| Previous Owner | Burke Marilyn | $204,000 |
Source: Public Records
Tax History Compared to Growth
Tax History
| Year | Tax Paid | Tax Assessment Tax Assessment Total Assessment is a certain percentage of the fair market value that is determined by local assessors to be the total taxable value of land and additions on the property. | Land | Improvement |
|---|---|---|---|---|
| 2025 | $8,509 | $738,000 | $268,900 | $469,100 |
| 2024 | $8,024 | $712,000 | $256,100 | $455,900 |
| 2023 | $7,665 | $688,700 | $232,800 | $455,900 |
| 2022 | $7,591 | $633,600 | $194,000 | $439,600 |
| 2021 | $7,166 | $590,300 | $194,000 | $396,300 |
| 2020 | $7,336 | $590,200 | $194,000 | $396,200 |
| 2019 | $6,471 | $515,600 | $183,100 | $332,500 |
| 2018 | $6,379 | $478,200 | $169,500 | $308,700 |
| 2017 | $6,585 | $464,700 | $161,400 | $303,300 |
| 2016 | $5,800 | $403,900 | $140,300 | $263,600 |
| 2015 | $5,687 | $389,500 | $140,300 | $249,200 |
| 2014 | $4,879 | $328,300 | $140,300 | $188,000 |
Source: Public Records
Map
Nearby Homes
- 5 Pearl St
- 166 Phipps St
- 83 Madison Ave
- 155 Kendrick Ave Unit T7
- 8 Jackson St Unit B2
- 57 Summer St
- 72 Federal Ave
- 33 Brook Rd
- 165 Granite St
- 94 Brook Rd Unit 3
- 18 Cliveden St Unit 201W
- 2 Cliveden St Unit 601E
- 34 South St Unit 202
- 293 Whitwell St
- 73 Scotch Pond Place
- 36 Bigelow St
- 215 Thomas Burgin Pkwy Unit 35
- 5 Main St
- 123 Elm St Unit D-8
- 10 Hughes St
- 14 N Payne St
- 14-16 N Payne St
- 24 N Payne St
- 13 N Payne St
- 13 N Payne St Unit 13
- 19 N Payne St
- 10 N Payne St
- 10 N Payne St Unit 10
- 10 N Payne St Unit 12
- 12 N Payne St Unit 12
- 11 N Payne St
- 33 Payne St Unit 2
- 33 Payne St
- 33 Payne St Unit 1
- 25 N Payne St
- 29 Payne St
- 29 Payne St Unit X
- 30 N Payne St
- 39 Payne St
- 30 Pearl St