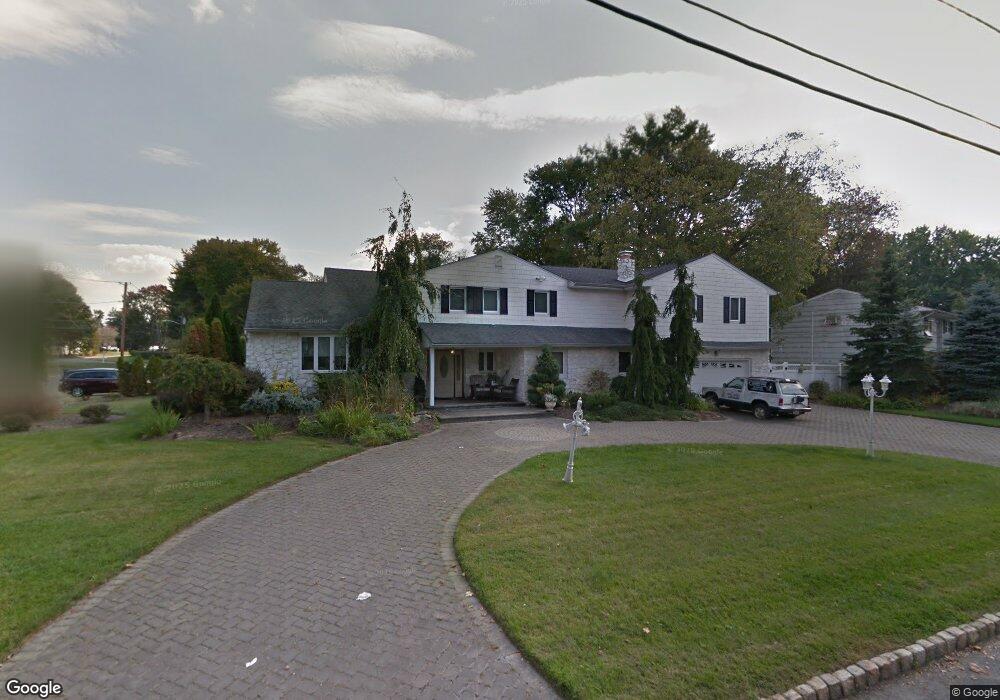
18 Nell Ct Fairfield, NJ 07004
Estimated Value: $809,003 - $1,012,000
Studio
--
Bath
3,462
Sq Ft
$270/Sq Ft
Est. Value
About This Home
This home is located at 18 Nell Ct, Fairfield, NJ 07004 and is currently estimated at $935,501, approximately $270 per square foot. 18 Nell Ct is a home located in Essex County with nearby schools including Adlai E Stevenson School, Churchill, and West Essex Middle School.
Ownership History
Date
Name
Owned For
Owner Type
Purchase Details
Closed on
Aug 31, 2023
Sold by
Essex County Sheriff
Bought by
Saleh Ahmed and Capital One Bank Usa Na
Current Estimated Value
Purchase Details
Closed on
Nov 4, 1996
Sold by
Tractor Caldwell
Bought by
Vinces Produce
Home Financials for this Owner
Home Financials are based on the most recent Mortgage that was taken out on this home.
Original Mortgage
$800,000
Interest Rate
7.83%
Create a Home Valuation Report for This Property
The Home Valuation Report is an in-depth analysis detailing your home's value as well as a comparison with similar homes in the area
Home Values in the Area
Average Home Value in this Area
Purchase History
| Date | Buyer | Sale Price | Title Company |
|---|---|---|---|
| Saleh Ahmed | $689,000 | None Listed On Document | |
| Vinces Produce | $1,200,000 | -- |
Source: Public Records
Mortgage History
| Date | Status | Borrower | Loan Amount |
|---|---|---|---|
| Previous Owner | Vinces Produce | $800,000 |
Source: Public Records
Tax History
| Year | Tax Paid | Tax Assessment Tax Assessment Total Assessment is a certain percentage of the fair market value that is determined by local assessors to be the total taxable value of land and additions on the property. | Land | Improvement |
|---|---|---|---|---|
| 2025 | $11,480 | $558,900 | $232,900 | $326,000 |
| 2024 | $11,480 | $559,200 | $232,900 | $326,300 |
Source: Public Records
Map
Nearby Homes
- 5 Addison Dr
- 20 West Dr
- 19 West Dr
- 74 Camp Ln
- 78 Lane Rd Unit 1
- 584-588 U S 46
- 96 Pier Ln
- 34 Carlos Dr
- 20 Barnsdale Rd
- 131 Horseneck Rd
- 140 W Greenbrook Rd
- 21 Styles Terrace
- 82 Stonyridge Dr Unit 82
- 128 Big Piece Rd
- 30 Andrea Dr
- 11 Cypress Ave
- 71 Schindler Way
- 53 Alpine Dr Unit Y156
- 8 Winfield Ct
- 15 Stepping Ridge Unit G2
Your Personal Tour Guide
Ask me questions while you tour the home.