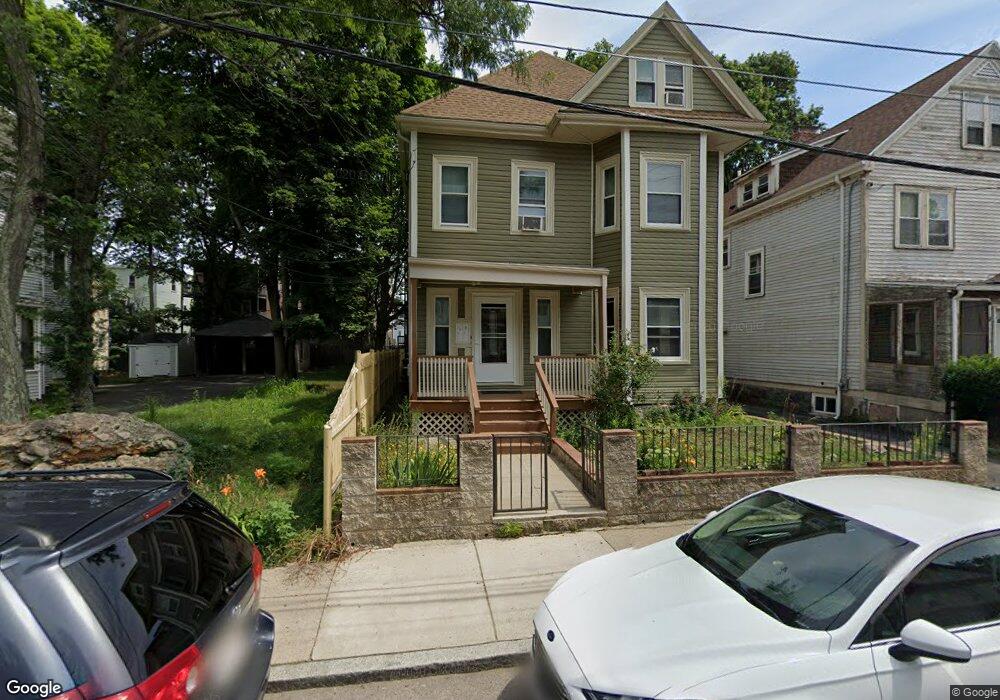
18 Nelson St Unit 1 Dorchester Center, MA 02124
West Codman Hill-West Lowe NeighborhoodEstimated Value: $965,000 - $1,052,287
3
Beds
1
Bath
1,150
Sq Ft
$866/Sq Ft
Est. Value
About This Home
This home is located at 18 Nelson St Unit 1, Dorchester Center, MA 02124 and is currently estimated at $995,572, approximately $865 per square foot. 18 Nelson St Unit 1 is a home located in Suffolk County with nearby schools including KIPP Academy Boston Charter School and Berea Seventh-day Adventist Academy.
Ownership History
Date
Name
Owned For
Owner Type
Purchase Details
Closed on
Jun 25, 2007
Sold by
Robinson Silvian
Bought by
Shorter Delores M
Current Estimated Value
Home Financials for this Owner
Home Financials are based on the most recent Mortgage that was taken out on this home.
Original Mortgage
$460,750
Outstanding Balance
$281,166
Interest Rate
6.14%
Mortgage Type
Purchase Money Mortgage
Estimated Equity
$714,406
Purchase Details
Closed on
Jan 24, 2007
Sold by
Fleming Edward L
Bought by
Robinson Silvian and Robinson Silvain
Home Financials for this Owner
Home Financials are based on the most recent Mortgage that was taken out on this home.
Original Mortgage
$350,000
Interest Rate
6.15%
Mortgage Type
Purchase Money Mortgage
Purchase Details
Closed on
Jul 16, 1992
Sold by
City Of Boston
Bought by
Osborn Steven E and Osborn Gloria R
Create a Home Valuation Report for This Property
The Home Valuation Report is an in-depth analysis detailing your home's value as well as a comparison with similar homes in the area
Home Values in the Area
Average Home Value in this Area
Purchase History
| Date | Buyer | Sale Price | Title Company |
|---|---|---|---|
| Shorter Delores M | $475,000 | -- | |
| Robinson Silvian | $270,000 | -- | |
| Osborn Steven E | $1,599 | -- |
Source: Public Records
Mortgage History
| Date | Status | Borrower | Loan Amount |
|---|---|---|---|
| Open | Shorter Delores M | $460,750 | |
| Previous Owner | Robinson Silvian | $350,000 | |
| Previous Owner | Osborn Steven E | $40,401 | |
| Closed | Osborn Steven E | $0 |
Source: Public Records
Tax History Compared to Growth
Tax History
| Year | Tax Paid | Tax Assessment Tax Assessment Total Assessment is a certain percentage of the fair market value that is determined by local assessors to be the total taxable value of land and additions on the property. | Land | Improvement |
|---|---|---|---|---|
| 2025 | $8,788 | $758,900 | $269,700 | $489,200 |
| 2024 | $8,028 | $736,500 | $233,400 | $503,100 |
| 2023 | $7,256 | $675,600 | $214,100 | $461,500 |
| 2022 | $6,871 | $631,500 | $200,100 | $431,400 |
| 2021 | $6,017 | $563,900 | $178,700 | $385,200 |
| 2020 | $5,178 | $490,300 | $172,500 | $317,800 |
| 2019 | $5,066 | $480,600 | $137,000 | $343,600 |
| 2018 | $4,498 | $429,200 | $137,000 | $292,200 |
| 2017 | $4,218 | $398,300 | $137,000 | $261,300 |
| 2016 | $4,095 | $372,300 | $137,000 | $235,300 |
| 2015 | $3,482 | $287,565 | $94,240 | $193,325 |
| 2014 | $3,229 | $256,690 | $94,240 | $162,450 |
Source: Public Records
Map
Nearby Homes
- 68 Mascot St
- 32 Crowell St
- 38 Mascot St Unit 3
- 139 Selden St
- 14-16 Jacob St
- 808 Morton St Unit 3
- 124 Selden St
- 73 Stanton St
- 44 Evans St
- 15-17 W Selden St
- 24 Marden Ave
- 18 Astoria St
- 10 Sutton St
- 5 Sutton St
- 5 Sutton St Unit 3B
- 140 Callender St
- 8 Oakhurst St Unit 4
- 147 Fairmount St
- 67 Wildwood St
- 141 Norfolk St
- 18 Nelson St
- 22 Nelson St
- 14 Nelson St
- 26 Nelson St
- 12 Nelson St
- 8 Nelson St
- 19 Crowell St
- 21 Crowell St
- 21 Crowell St Unit 2
- 30-32 Nelson St Unit 3
- 30-32 Nelson St
- 32 Nelson St Unit 2
- 30-32 Nelson St Unit 1
- 19 Nelson St
- 30 Nelson St Unit 32
- 17 Crowell St Unit 2
- 17 Crowell St
- 17 Crowell St
- 17 Crowell St Unit 2--3
- 15 Nelson St