18 Newton Way Bar Harbor, ME 04609
Estimated Value: $727,000 - $790,000
3
Beds
2
Baths
1,160
Sq Ft
$661/Sq Ft
Est. Value
About This Home
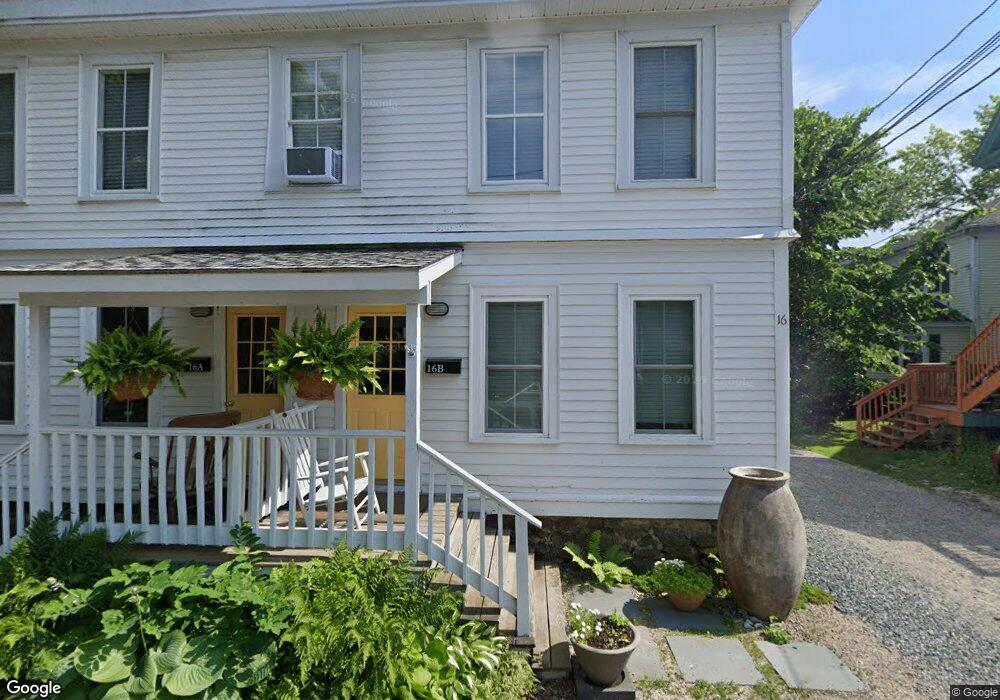
This home is located at 18 Newton Way, Bar Harbor, ME 04609 and is currently estimated at $767,074, approximately $661 per square foot. 18 Newton Way is a home located in Hancock County with nearby schools including Conners-Emerson School, Mt. Desert Island High School, and Acadia School.
Ownership History
Date
Name
Owned For
Owner Type
Purchase Details
Closed on
Mar 15, 2019
Sold by
Demuro Leonard J
Bought by
Mytar Misha and Farrenkof Daniel
Current Estimated Value
Home Financials for this Owner
Home Financials are based on the most recent Mortgage that was taken out on this home.
Original Mortgage
$1
Outstanding Balance
$1
Interest Rate
4.4%
Mortgage Type
Purchase Money Mortgage
Create a Home Valuation Report for This Property
The Home Valuation Report is an in-depth analysis detailing your home's value as well as a comparison with similar homes in the area
Home Values in the Area
Average Home Value in this Area
Purchase History
| Date | Buyer | Sale Price | Title Company |
|---|---|---|---|
| Mytar Misha | -- | -- | |
| Mytar Misha | -- | -- | |
| Mytar Misha | -- | -- |
Source: Public Records
Mortgage History
| Date | Status | Borrower | Loan Amount |
|---|---|---|---|
| Open | Mytar Misha | $1 | |
| Closed | Mytar Misha | $0 |
Source: Public Records
Tax History Compared to Growth
Tax History
| Year | Tax Paid | Tax Assessment Tax Assessment Total Assessment is a certain percentage of the fair market value that is determined by local assessors to be the total taxable value of land and additions on the property. | Land | Improvement |
|---|---|---|---|---|
| 2024 | $6,679 | $665,200 | $209,300 | $455,900 |
| 2023 | $1,817 | $209,300 | $209,300 | $0 |
| 2022 | $1,923 | $206,300 | $177,100 | $29,200 |
| 2021 | $2,711 | $278,300 | $201,300 | $77,000 |
| 2020 | $1,687 | $141,800 | $71,000 | $70,800 |
| 2019 | $1,664 | $140,400 | $70,300 | $70,100 |
| 2018 | $1,623 | $140,400 | $70,300 | $70,100 |
| 2017 | $1,539 | $140,400 | $70,300 | $70,100 |
| 2016 | $1,506 | $140,400 | $70,300 | $70,100 |
| 2015 | $1,487 | $140,400 | $70,300 | $70,100 |
| 2014 | $1,435 | $140,400 | $70,300 | $70,100 |
| 2012 | $1,382 | $140,400 | $70,300 | $70,100 |
Source: Public Records
Map
Nearby Homes
- 14 Pleasant St
- 3 Wayman Ln
- 7 Wayman Ln
- 18 Glen Mary Rd
- 12 Bowles Ave
- 5 Bowles Ave
- 2 Bowles Ave
- 41 Hamilton Hill Way
- 62 Sols Cliff Rd
- 18 Greenway Ct
- 10 Harbor Lights Rd
- 2 Lookout Point Rd
- 18 Hamor Ln
- 472 Schooner Head Rd
- 742 Eagle Lake Rd
- 29 Equity Ln
- 55 Owls Nest Ln
- 102 Degregoire Park Unit 2
- 28 Winding Brook Rd
- 0 Juniper Ledge Rd Unit 1646699