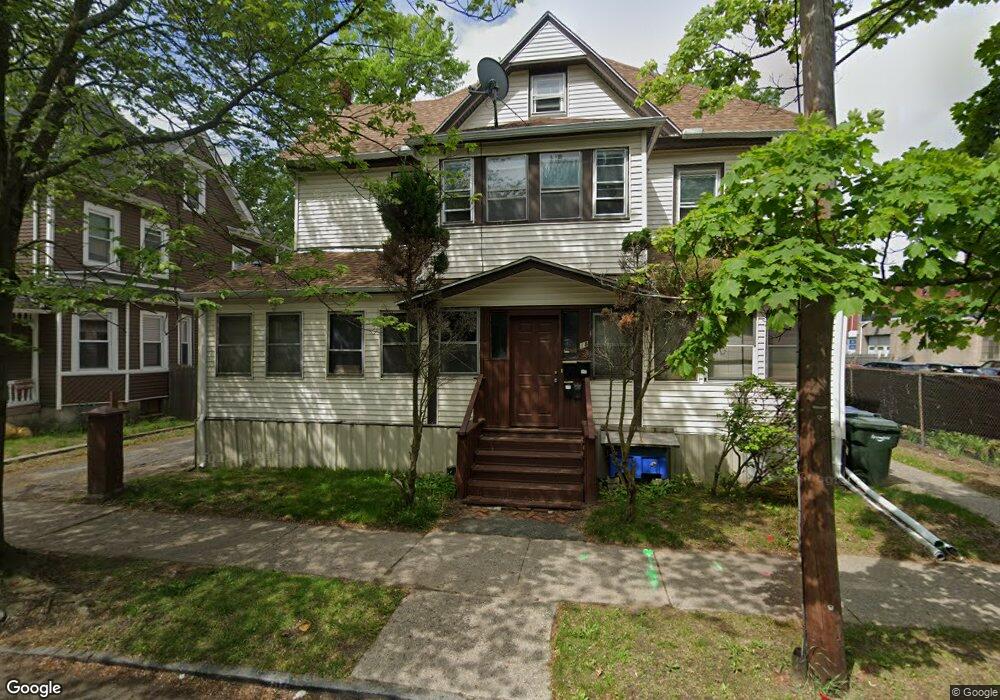
18 Northampton Ave Springfield, MA 01109
Upper Hill NeighborhoodEstimated Value: $324,401 - $438,000
10
Beds
2
Baths
4,245
Sq Ft
$91/Sq Ft
Est. Value
About This Home
This home is located at 18 Northampton Ave, Springfield, MA 01109 and is currently estimated at $385,350, approximately $90 per square foot. 18 Northampton Ave is a home located in Hampden County with nearby schools including Glickman Elementary, M Marcus Kiley Middle, and Springfield High School of Science and Technology.
Ownership History
Date
Name
Owned For
Owner Type
Purchase Details
Closed on
Jun 5, 2019
Sold by
Freeman Sheila A and Freeman Jonathan M
Bought by
Freeman Jonathan M
Current Estimated Value
Purchase Details
Closed on
Oct 26, 2018
Sold by
Freeman Sheila A and Freeman Jonathan M
Bought by
Freeman Sheila A and Freeman Jonathan M
Purchase Details
Closed on
Nov 17, 2004
Sold by
Freeman Sheila A
Bought by
Jackson Jonathan M and Freeman Sheila A
Create a Home Valuation Report for This Property
The Home Valuation Report is an in-depth analysis detailing your home's value as well as a comparison with similar homes in the area
Home Values in the Area
Average Home Value in this Area
Purchase History
| Date | Buyer | Sale Price | Title Company |
|---|---|---|---|
| Freeman Jonathan M | -- | -- | |
| Freeman Sheila A | -- | -- | |
| Jackson Jonathan M | -- | -- |
Source: Public Records
Tax History
| Year | Tax Paid | Tax Assessment Tax Assessment Total Assessment is a certain percentage of the fair market value that is determined by local assessors to be the total taxable value of land and additions on the property. | Land | Improvement |
|---|---|---|---|---|
| 2025 | $4,002 | $255,200 | $31,100 | $224,100 |
| 2024 | $3,466 | $215,800 | $31,100 | $184,700 |
| 2023 | $3,153 | $184,900 | $28,300 | $156,600 |
| 2022 | $3,205 | $170,300 | $26,400 | $143,900 |
| 2021 | $3,251 | $172,000 | $18,700 | $153,300 |
| 2020 | $3,281 | $168,000 | $18,700 | $149,300 |
| 2019 | $3,251 | $165,200 | $16,000 | $149,200 |
| 2018 | $3,110 | $168,000 | $16,000 | $152,000 |
| 2017 | $3,110 | $158,200 | $15,000 | $143,200 |
| 2016 | $2,886 | $146,800 | $15,000 | $131,800 |
| 2015 | $2,685 | $136,500 | $15,000 | $121,500 |
Source: Public Records
Map
Nearby Homes
- 19 Westford Ave
- 290 Quincy St
- 52-56 Andrew St
- 46 Mapledell St
- 21 Westford Cir
- 65 Montrose St
- 189 Northampton Ave
- 124-126 Westford Cir
- 145 Cambridge St
- 48-50 Dresden St
- 15 Kenyon St
- 22-24 Westminster St
- 25 Dresden St
- 31-33 Suffolk St
- 163 Marion St
- 90 Cambridge St
- 62-64 Bristol St
- 41 Olive St
- 135-137 Suffolk St
- 158 Bowles St
- 26 Northampton Ave
- 19 Wilbraham Ave
- 17 Wilbraham Ave
- 25 Wilbraham Ave
- 23 Wilbraham Ave Unit 2nd floor
- 23 Wilbraham Ave
- 38 Northampton Ave
- 19 Northampton Ave
- 31 Wilbraham Ave
- 13 Northampton Ave
- 31 Northampton Ave
- 35 Wilbraham Ave
- 33 Wilbraham Ave
- 37 Northampton Ave
- 39 Wilbraham Ave Unit 41
- 14 Wilbraham Ave
- 20 Westford Ave
- 20 Westford Ave
- 26 Westford Ave Unit 28
- 14 Westford Ave
Your Personal Tour Guide
Ask me questions while you tour the home.