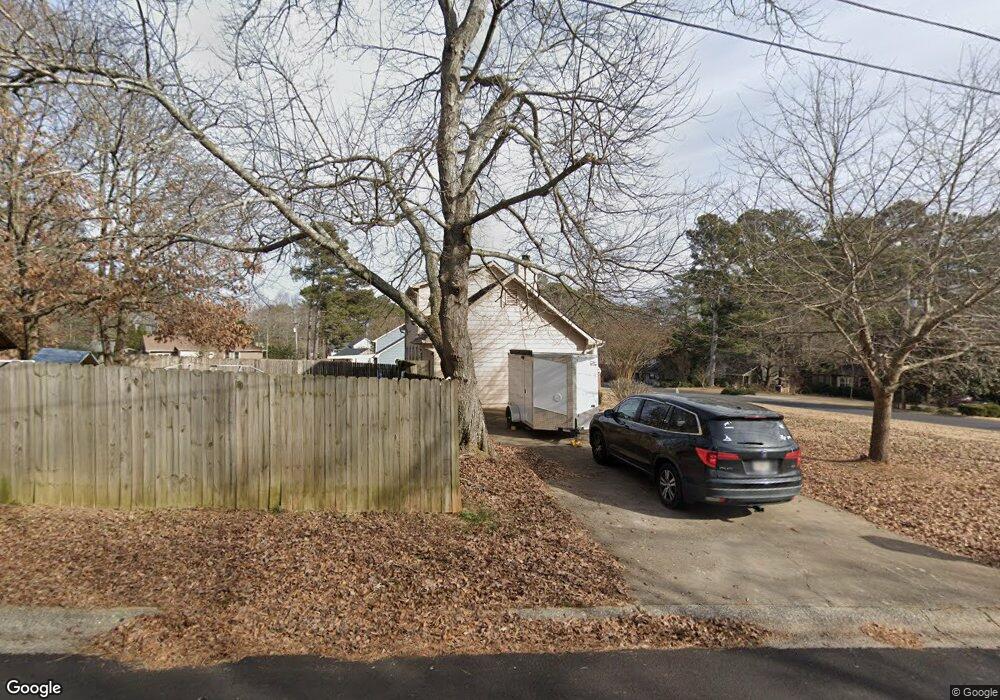
18 Oak Ct Unit 26 Dallas, GA 30157
Estimated Value: $296,073 - $340,000
3
Beds
4
Baths
1,828
Sq Ft
$171/Sq Ft
Est. Value
About This Home
This home is located at 18 Oak Ct Unit 26, Dallas, GA 30157 and is currently estimated at $311,768, approximately $170 per square foot. 18 Oak Ct Unit 26 is a home located in Paulding County with nearby schools including Nebo Elementary School, South Paulding Middle School, and Paulding County High School.
Ownership History
Date
Name
Owned For
Owner Type
Purchase Details
Closed on
Jul 19, 2021
Sold by
Olsen Michelle Lee
Bought by
Williams Carol L and Williams Courtney Deleana
Current Estimated Value
Home Financials for this Owner
Home Financials are based on the most recent Mortgage that was taken out on this home.
Original Mortgage
$230,743
Outstanding Balance
$209,459
Interest Rate
2.93%
Mortgage Type
FHA
Estimated Equity
$102,309
Purchase Details
Closed on
Oct 4, 2018
Sold by
Zahn Warner W
Bought by
Olsen Michelle Lee
Home Financials for this Owner
Home Financials are based on the most recent Mortgage that was taken out on this home.
Original Mortgage
$128,205
Interest Rate
5.5%
Mortgage Type
FHA
Purchase Details
Closed on
Jan 31, 2002
Sold by
Miles Amanda V
Bought by
Zahn Warner W and Zahn Debora K
Home Financials for this Owner
Home Financials are based on the most recent Mortgage that was taken out on this home.
Original Mortgage
$107,512
Interest Rate
7.07%
Mortgage Type
FHA
Purchase Details
Closed on
Mar 22, 1990
Create a Home Valuation Report for This Property
The Home Valuation Report is an in-depth analysis detailing your home's value as well as a comparison with similar homes in the area
Home Values in the Area
Average Home Value in this Area
Purchase History
| Date | Buyer | Sale Price | Title Company |
|---|---|---|---|
| Williams Carol L | $235,000 | -- | |
| Olsen Michelle Lee | $140,000 | -- | |
| Zahn Warner W | $109,200 | -- | |
| -- | $44,000 | -- |
Source: Public Records
Mortgage History
| Date | Status | Borrower | Loan Amount |
|---|---|---|---|
| Open | Williams Carol L | $230,743 | |
| Previous Owner | Olsen Michelle Lee | $128,205 | |
| Previous Owner | Zahn Warner W | $107,512 |
Source: Public Records
Tax History Compared to Growth
Tax History
| Year | Tax Paid | Tax Assessment Tax Assessment Total Assessment is a certain percentage of the fair market value that is determined by local assessors to be the total taxable value of land and additions on the property. | Land | Improvement |
|---|---|---|---|---|
| 2024 | $2,595 | $104,328 | $12,000 | $92,328 |
| 2023 | $2,628 | $100,808 | $12,000 | $88,808 |
| 2022 | $2,451 | $96,048 | $12,000 | $84,048 |
| 2021 | $1,719 | $61,012 | $8,000 | $53,012 |
| 2020 | $1,814 | $62,916 | $8,000 | $54,916 |
| 2019 | $1,631 | $56,268 | $8,000 | $48,268 |
| 2018 | $1,563 | $51,864 | $8,000 | $43,864 |
| 2017 | $1,318 | $43,152 | $8,000 | $35,152 |
| 2016 | $1,112 | $36,772 | $8,000 | $28,772 |
| 2015 | $913 | $29,676 | $8,000 | $21,676 |
| 2014 | $872 | $27,640 | $8,000 | $19,640 |
| 2013 | -- | $21,080 | $8,000 | $13,080 |
Source: Public Records
Map
Nearby Homes
- 18 Oak Ct
- 18 Oak Ct Unit 5
- 18 Oak Ct
- 0 Oak Ct Unit 8516908
- 0 Oak Ct Unit 8416755
- 0 Oak Ct Unit 3089489
- 0 Oak Ct Unit 3089480
- 0 Oak Ct Unit 3089474
- 0 Oak Ct Unit 8460856
- 0 Oak Ct Unit 7627587
- 0 Oak Ct Unit 8299599
- 0 Oak Ct
- 6th 6th Ave
- 67 Oak Place
- 44 Oak Ct
- 44 Oak Ct Unit 228
- 112 6th Ave W
- 107 Oak Ct
- 93 6th Ave W Unit 5
- 51 Oak Ct