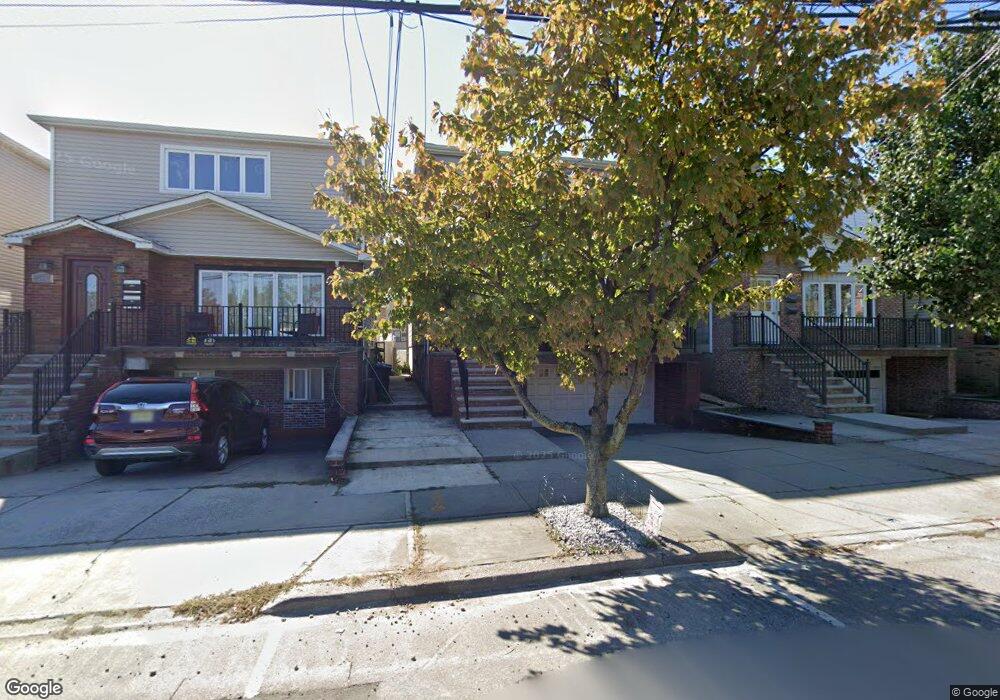
18 Oak St Bayonne, NJ 07002
Constable Hook NeighborhoodEstimated Value: $734,000 - $934,000
--
Bed
--
Bath
2,736
Sq Ft
$300/Sq Ft
Est. Value
About This Home
This home is located at 18 Oak St, Bayonne, NJ 07002 and is currently estimated at $820,100, approximately $299 per square foot. 18 Oak St is a home located in Hudson County with nearby schools including Bayonne High School, All Saints Catholic Academy, and Beacon Christian Academy.
Ownership History
Date
Name
Owned For
Owner Type
Purchase Details
Closed on
Dec 7, 2021
Sold by
Dawn Vulcano
Bought by
Vulcan Dawn and Vulcano Kim
Current Estimated Value
Home Financials for this Owner
Home Financials are based on the most recent Mortgage that was taken out on this home.
Original Mortgage
$190,000
Interest Rate
2.98%
Mortgage Type
New Conventional
Create a Home Valuation Report for This Property
The Home Valuation Report is an in-depth analysis detailing your home's value as well as a comparison with similar homes in the area
Home Values in the Area
Average Home Value in this Area
Purchase History
| Date | Buyer | Sale Price | Title Company |
|---|---|---|---|
| Vulcan Dawn | $180,000 | Chicago Title | |
| Vulcan Dawn | $180,000 | Chicago Title |
Source: Public Records
Mortgage History
| Date | Status | Borrower | Loan Amount |
|---|---|---|---|
| Previous Owner | Vulcan Dawn | $190,000 |
Source: Public Records
Tax History Compared to Growth
Tax History
| Year | Tax Paid | Tax Assessment Tax Assessment Total Assessment is a certain percentage of the fair market value that is determined by local assessors to be the total taxable value of land and additions on the property. | Land | Improvement |
|---|---|---|---|---|
| 2025 | $14,525 | $519,500 | $177,500 | $342,000 |
| 2024 | $13,938 | $519,500 | $177,500 | $342,000 |
| 2023 | $13,938 | $519,500 | $177,500 | $342,000 |
| 2022 | $13,678 | $519,500 | $177,500 | $342,000 |
| 2021 | $13,569 | $519,500 | $177,500 | $342,000 |
| 2020 | $13,330 | $519,500 | $177,500 | $342,000 |
| 2019 | $15,698 | $181,900 | $48,000 | $133,900 |
| 2018 | $15,385 | $181,900 | $48,000 | $133,900 |
| 2017 | $14,987 | $181,900 | $48,000 | $133,900 |
| 2016 | $14,434 | $181,900 | $48,000 | $133,900 |
| 2015 | $13,709 | $181,900 | $48,000 | $133,900 |
| 2014 | $13,292 | $181,900 | $48,000 | $133,900 |
Source: Public Records
Map
Nearby Homes