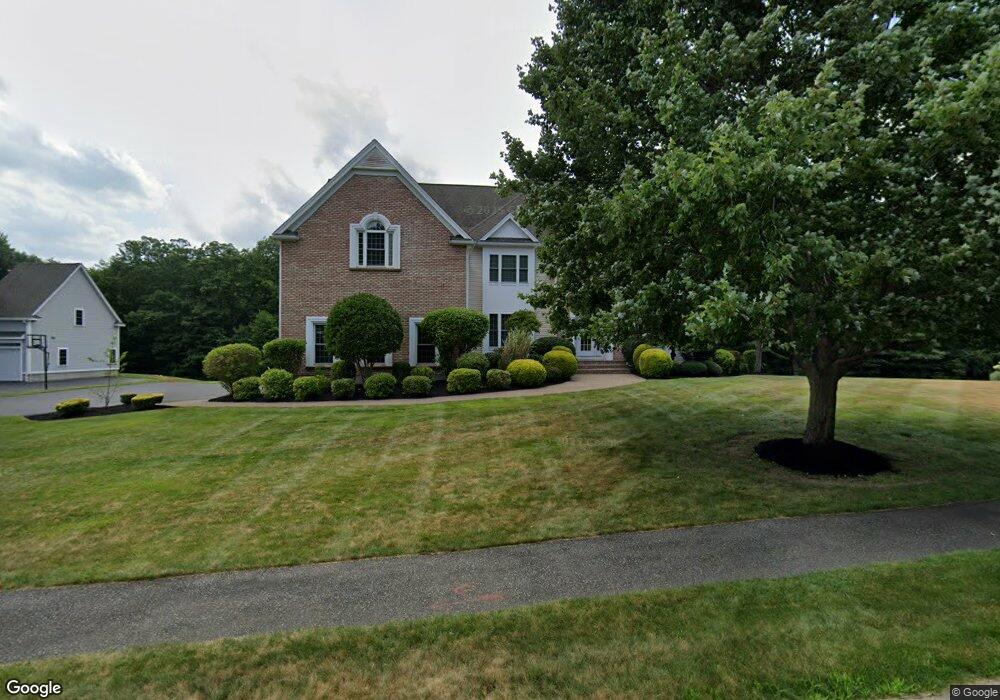
18 Oak St Hopkinton, MA 01748
Estimated Value: $1,785,931 - $1,881,000
4
Beds
5
Baths
5,300
Sq Ft
$348/Sq Ft
Est. Value
About This Home
This home is located at 18 Oak St, Hopkinton, MA 01748 and is currently estimated at $1,844,483, approximately $348 per square foot. 18 Oak St is a home located in Middlesex County with nearby schools including Marathon Elementary School, Hopkins Elementary School, and Elmwood Elementary School.
Ownership History
Date
Name
Owned For
Owner Type
Purchase Details
Closed on
Mar 31, 2006
Sold by
Sirva Relocation Cred
Bought by
Orondo Peter O
Current Estimated Value
Home Financials for this Owner
Home Financials are based on the most recent Mortgage that was taken out on this home.
Original Mortgage
$104,500
Outstanding Balance
$59,914
Interest Rate
6.32%
Mortgage Type
Purchase Money Mortgage
Estimated Equity
$1,784,569
Purchase Details
Closed on
Aug 12, 2004
Sold by
20Th Century Mgmt Corp
Bought by
Berndt Andrea F and Berndt Philip C
Home Financials for this Owner
Home Financials are based on the most recent Mortgage that was taken out on this home.
Original Mortgage
$550,000
Interest Rate
6.16%
Mortgage Type
Purchase Money Mortgage
Create a Home Valuation Report for This Property
The Home Valuation Report is an in-depth analysis detailing your home's value as well as a comparison with similar homes in the area
Home Values in the Area
Average Home Value in this Area
Purchase History
| Date | Buyer | Sale Price | Title Company |
|---|---|---|---|
| Orondo Peter O | $1,045,000 | -- | |
| Sirva Relocation Cred | $1,045,000 | -- | |
| Berndt Andrea F | $989,900 | -- |
Source: Public Records
Mortgage History
| Date | Status | Borrower | Loan Amount |
|---|---|---|---|
| Open | Sirva Relocation Cred | $104,500 | |
| Open | Orondo Peter O | $836,000 | |
| Previous Owner | Berndt Andrea F | $550,000 |
Source: Public Records
Tax History Compared to Growth
Tax History
| Year | Tax Paid | Tax Assessment Tax Assessment Total Assessment is a certain percentage of the fair market value that is determined by local assessors to be the total taxable value of land and additions on the property. | Land | Improvement |
|---|---|---|---|---|
| 2025 | $22,818 | $1,609,200 | $479,600 | $1,129,600 |
| 2024 | $20,514 | $1,404,100 | $456,900 | $947,200 |
| 2023 | $20,336 | $1,286,300 | $377,200 | $909,100 |
| 2022 | $20,002 | $1,174,500 | $342,800 | $831,700 |
| 2021 | $19,203 | $1,124,300 | $333,200 | $791,100 |
| 2020 | $18,428 | $1,095,600 | $325,400 | $770,200 |
| 2019 | $18,310 | $1,066,400 | $301,400 | $765,000 |
| 2018 | $17,556 | $1,038,800 | $295,300 | $743,500 |
| 2017 | $16,997 | $1,011,700 | $286,500 | $725,200 |
| 2016 | $16,775 | $985,000 | $280,900 | $704,100 |
| 2015 | $16,733 | $931,700 | $272,700 | $659,000 |
Source: Public Records
Map
Nearby Homes
- 2 Emerald Dr
- 10 Oak St
- 7 Davenport Ln Unit 7
- 20 Davenport Ln Unit 20
- 11 Kimball Rd
- 283 Hayden Rowe St
- 180 Ash St
- Lot 2 Hanlon Rd
- 5 Myrtle Ave Unit 2
- 52 S Mill St
- 7 Myrtle Ave Unit 3
- 13 Fitch Ave
- 13 Fitch Ave Unit 19
- 16 Fitch Ave Unit 6
- 11 Fitch Ave Unit 18
- 14 Fitch Ave Unit 7
- 114 Walden Way Unit 114
- 12 Fitch Ave Unit 8
- 15 Chamberlain St
- 10 Fitch Ave Unit 9