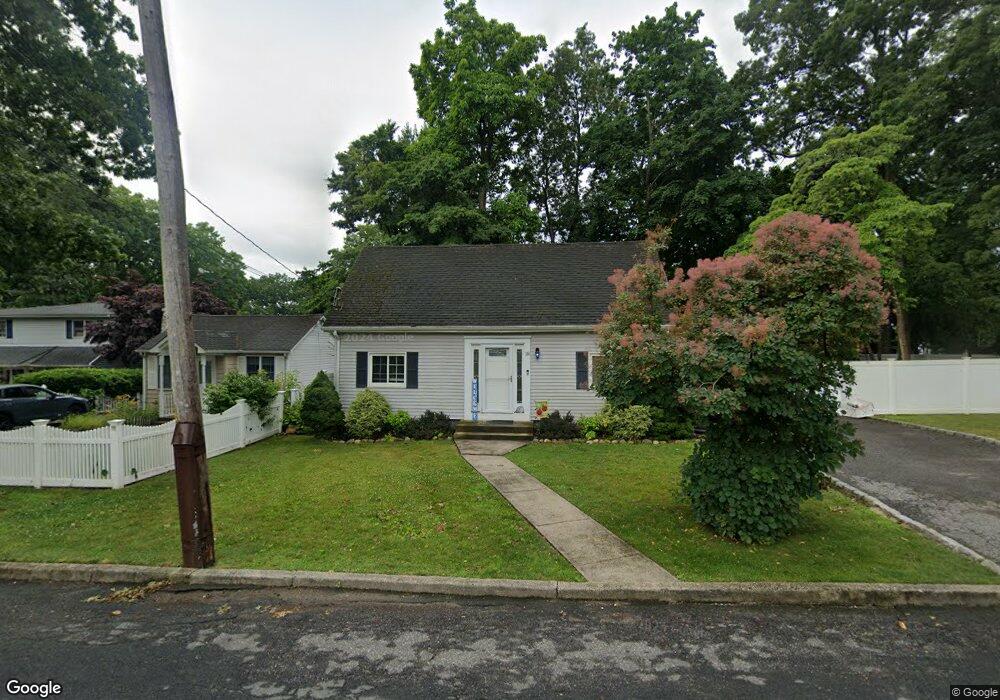
18 Oak St Nesconset, NY 11767
Estimated Value: $532,000 - $560,413
3
Beds
2
Baths
1,055
Sq Ft
$519/Sq Ft
Est. Value
About This Home
This home is located at 18 Oak St, Nesconset, NY 11767 and is currently estimated at $547,103, approximately $518 per square foot. 18 Oak St is a home located in Suffolk County with nearby schools including Tackan Elementary School and St Patrick Elementary School.
Ownership History
Date
Name
Owned For
Owner Type
Purchase Details
Closed on
Jul 22, 2016
Sold by
Tynebor Christopher and Tynebor Minerva Jane
Bought by
Orlando Christopher J and Orlando Christopher J
Current Estimated Value
Home Financials for this Owner
Home Financials are based on the most recent Mortgage that was taken out on this home.
Original Mortgage
$289,750
Outstanding Balance
$230,559
Interest Rate
3.48%
Mortgage Type
New Conventional
Estimated Equity
$316,544
Purchase Details
Closed on
Apr 16, 2007
Sold by
Wilson Carol
Bought by
Tynebor Christopher
Create a Home Valuation Report for This Property
The Home Valuation Report is an in-depth analysis detailing your home's value as well as a comparison with similar homes in the area
Home Values in the Area
Average Home Value in this Area
Purchase History
| Date | Buyer | Sale Price | Title Company |
|---|---|---|---|
| Orlando Christopher J | $305,000 | None Available | |
| Orlando Christopher J | $305,000 | None Available | |
| Tynebor Christopher | $320,000 | Harold Shapiro | |
| Tynebor Christopher | $320,000 | Harold Shapiro |
Source: Public Records
Mortgage History
| Date | Status | Borrower | Loan Amount |
|---|---|---|---|
| Open | Orlando Christopher J | $289,750 | |
| Closed | Orlando Christopher J | $289,750 |
Source: Public Records
Tax History Compared to Growth
Tax History
| Year | Tax Paid | Tax Assessment Tax Assessment Total Assessment is a certain percentage of the fair market value that is determined by local assessors to be the total taxable value of land and additions on the property. | Land | Improvement |
|---|---|---|---|---|
| 2024 | $7,808 | $2,900 | $100 | $2,800 |
| 2023 | $7,808 | $2,900 | $100 | $2,800 |
| 2022 | $5,649 | $2,900 | $100 | $2,800 |
| 2021 | $5,649 | $2,900 | $100 | $2,800 |
| 2020 | $7,402 | $2,900 | $100 | $2,800 |
| 2019 | $7,402 | $0 | $0 | $0 |
| 2018 | -- | $2,900 | $100 | $2,800 |
| 2017 | $5,827 | $2,900 | $100 | $2,800 |
| 2016 | $5,770 | $2,900 | $100 | $2,800 |
| 2015 | -- | $2,900 | $100 | $2,800 |
| 2014 | -- | $2,900 | $100 | $2,800 |
Source: Public Records
Map
Nearby Homes